Figures & data
Table 1 Baseline Data of MDD Patients and Healthy Controls
Figure 1 Discrimination model built using MDD patients with SI and HCs in training set: (A) The built OPLS-DA model showing an obvious separation between MDD patients with SI (red dot) and HCs (green dot); (B) 399-iteration permutation test showed that the model was valid, as the Q2 and R2 values yielded by the permutation test (bottom left) were significantly lower than their original values (top right).
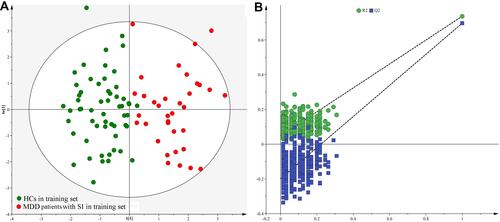
Figure 2 T-predicted scatter plot from the OPLS-DA model: (A) both MDD patients with SI (lemon dot) and HCs (purple dot) from testing set could be correctly predicted; (B) the model was effective in distinguishing MDD patients with SI (red dot) from MDD patients without SI (blue dot).
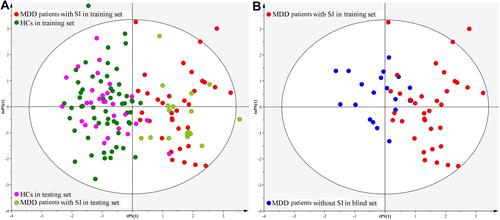
Figure 3 Potential biomarkers for diagnosing MDD patients with SI: (A) the differences of these four potential biomarkers among the three groups; (B) the levels of potential biomarkers in the 20 MDD patients with SI were increased after one-month treatment, and both HDRS score and BSI-CV score were also significantly improved.
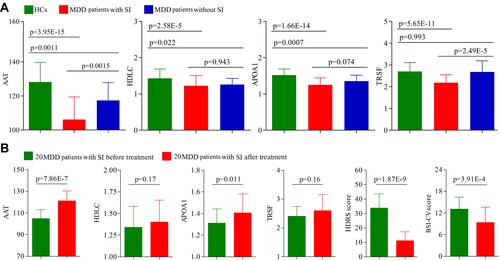
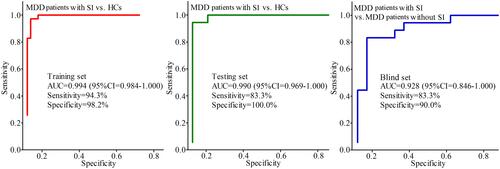
Figure 4 Diagnostic performances of these potential biomarkers. The panel consisting of these potential biomarkers yielded the excellent diagnostic performances with AUC>9.0 in training set, testing set and blind set.