Figures & data
Table 1 Primers for Real-Time RT-PCR
Figure 1 Analysis of absolute concentration of bile acids in KLA mice and healthy controls. Levels of lithocholic acid and deoxycholic acid in the feces (A) and serum (B) of were detected in mice with KLA and in the healthy controls. All data were expressed as means ± S.E.M. (N = 10–15); *P < 0.05, **P < 0.01 as compared with that in healthy controls.
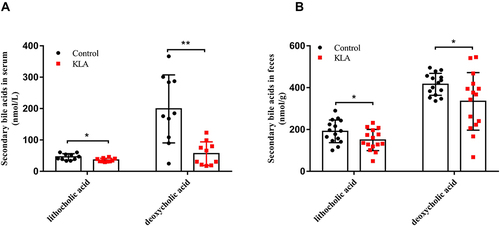
Figure 2 Overall structure of microbiota in KLA mice and controls. (A) The species accumulation curve (smooth tendency) shows sufficient sample numbers in a boxplot of the observed species. The X-axis indicates the number of samples and the Y-axis shows the observed species (OTU number). (B) The OTU Venn diagram shows the OTUs that overlap in KLA mice and healthy controls. (C) Alpha diversity (Shannon index) of 16S rRNA genes from KLA mice and healthy controls. (D) PLS-DA score plot of species abundance in samples from individuals with KLA and healthy controls. PERMANOVA with the Bray–Curtis distance was used to assess the significance of differences between the two groups (P= 0.002). (E) Abundance of discriminative OTUs in the taxonomic distributions at the family levels between KLA mice and healthy controls. P-values are determined by two-tailed Wilcoxon rank-sum test (C) and two-sample t-test (E) (N = 15); *P < 0.05, ***P < 0.001 as compared with healthy controls.
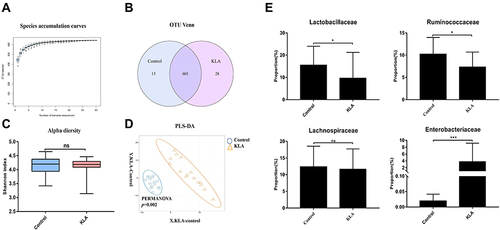
Table 2 Body Weight and Liver Weights
Figure 3 Effects of SBAs on K. pneumoniae-induced liver abscess. (A) Kaplan-Meier survival plot of SBA-treated and untreated mice after K. pneumoniae infection. (B and C) CFUs of K. pneumoniae in blood (B) and liver (C) at 48 h after infection in SBA-treated and untreated mice. (D) Liver abscess and necrosis were examined by hematoxylin and eosin staining and observed under a microscope (magnification, ×200) in SBA-treated and untreated mice 48 h after K. pneumoniae infection. The red arrowheads indicate liver abscess. KLA mice show increased histologic evidence of liver abscess and necrosis, as indicated by pathological scores, following K. pneumoniae challenge. (E) Representative TUNEL staining of sections from livers of SBA-treated and untreated mice (magnification, ×200) and statistical analysis of the number of TUNEL-positive cells per total number of cells. The white arrowheads indicate apoptotic hepatocytes. The number of cells in at least 10 microscopic fields was counted. (F) Representative immunohistochemistry staining for F4/80 from livers of SBA-treated and untreated mice (magnification, ×200) and statistical analysis of the number of F4/80-positive cells per field. The red arrows indicate F4/80 positive cells. Cells in eight high-power fields were counted. All data are expressed as means ± S.E.M (n = 8–10); *P < 0.05, **P < 0.01, ***P < 0.001 as compared with healthy controls; &&&P < 0.001 as compared with KLA mice.
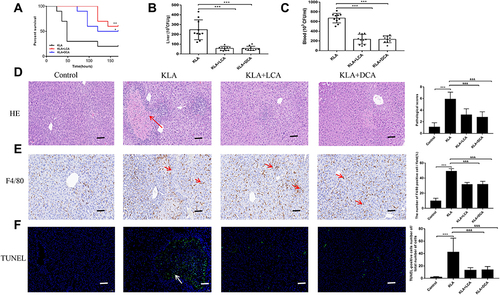
Figure 4 SBAs ameliorate inflammation associated with K. pneumoniae-induced liver abscess in. (A) Real-time RT-PCR analysis of TGF-β, MCP-1, KC, and IP-10 mRNAs expression in four different groups. (B and C) The levels of inflammatory serum markers (IL-6, MCP-1, and IL-10) (B), ALT, and AST (C) in serum from KLA mice that were treated with corn oil, LCA, or DCA. All data are expressed as means ± S.E.M (n = 8), ***P < 0.001 as compared with healthy mice; &P < 0.05, &&&P < 0.001 as compared with KLA mice.
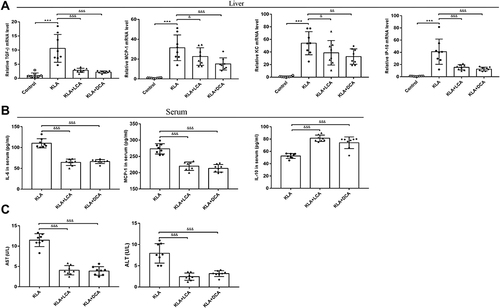
Figure 5 Effects of SBAs on NF-κB signaling in the livers of K. pneumoniae infected mice. (A) Representative gels for p-IκBα (upper panel), IκBα (middle panel), and β-actin (lower panel) are shown. (B) Quantitative analysis of p-IκBα was performed by scanning densitometry. (C) Representative gels for p-p65 (upper panel), p-p50 (middle panel), and LaminB1 (lower panel) are shown. (D) Quantitative analysis for p-p65 was performed by scanning densitometry. (E) Quantitative analysis for p-p50 was performed by scanning densitometry. (F) Representative photomicrographs of liver p-IκBα, p-p50, and p-p65 are consecutively shown. Original magnification: 200×. The red arrowheads indicate p-IκBα, nuclear p50, and p65-positive cells, respectively. (G) p-IκBα-positive cells were compared between different groups. (H) Nuclear p50-positive cells were compared between different groups. (I) Nuclear p65-positive cells were compared between different groups. All experiments were duplicated for three times. Data are expressed as means ± S.E.M (n = 10); **P < 0.01,***P < 0.001 as compared with healthy controls; &P < 0.05, &&P < 0.01, &&&P < 0.001 as compared with KLA mice.
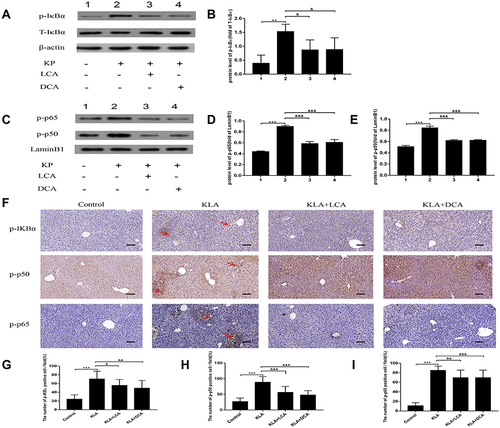
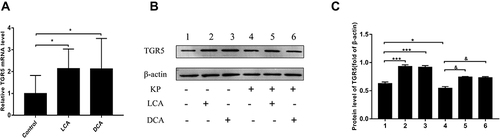
Figure 6 Effects of SBAs on hepatic TGR5 signaling. (A) Hepatic TGR5 mRNA was measured by real-time RT-PCR. (B) Representative gels for TGR5 and β-actin are shown. (C) Quantitative analysis of TGR5 was performed by scanning densitometry. All experiments were duplicated for three times. Data are expressed as means ± S.E.M (n = 10); *P < 0.05, ***P < 0.001 as compared with healthy controls; &P<0.05 as compared with KLA mice.