Figures & data
Figure 1 Genes differentially expressed in patients with HBV, HCC or both. Levels of mRNA were analyzed to identify differentially expressed genes, and results are shown as volcano plots comparing (A) HBV and healthy samples, (B) HBV-related HCC and healthy samples, or (C) stage-specific HCC and healthy samples. Red represents up-regulated genes, and blue represents down-regulated genes. (D) Venn diagram showing 5823 differentially expressed genes among stages I–IV of HCC. (E) Venn diagram showing 901 genes differentially regulated between disease and healthy states, and the subset of 65 genes shared among patients with HBV or HCC or both. (F) Differentially expressed genes clustered into 10 modules (M) based on protein-protein interactions. The middle cluster contains genes overlapping among all three groups (HBV, HCC, HBV-associated HCC). Red nodes contain differentially expressed genes present in all three groups; orange nodes, genes in two groups; blue nodes, genes only in HBV; yellow nodes, genes only in HBV-associated HCC; purple nodes, genes only in HCC.
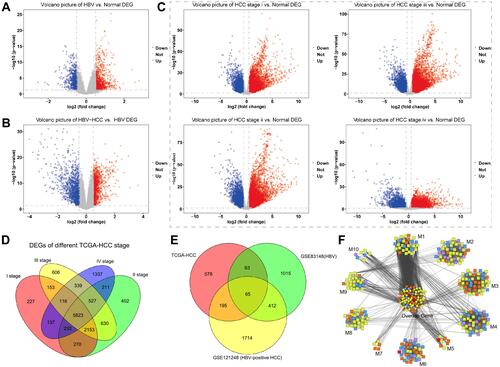
Figure 2 Protein crosstalk and signaling pathways associated with genes bridging chronic HBV infection and HCC. (A) Protein-protein interactions were assessed by measuring crosstalk between modules shared by HBV and HCC. Red nodes, module M1; blue nodes, M3; pink nodes, M5; green nodes, M6; yellow nodes, M7; orange nodes, M9; and purple nodes, M10. (B) KEGG analysis identified signalling pathways involving module genes from all groups. The most common pathways are related to cancer (orange arrow), infection (purple triangle), metabolism (green square), and immune system (red diamond). Yellow circles are labeled with their corresponding module number.
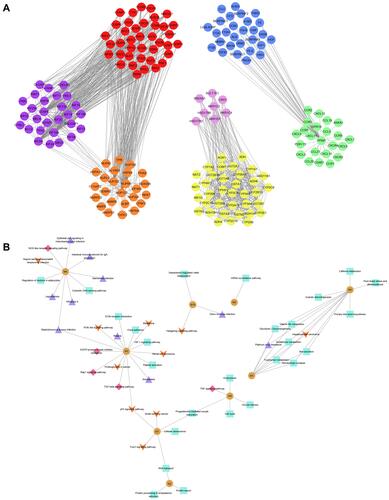
Figure 3 Identification of bridge genes for HBV-induced HCC. (A) Heatmap depicting 32 dysregulated genes in the progression from HBV to HCC. Red represents up-regulated and blue represents down-regulated. (B) Line graph depicting survival probabilities over time for HCC patients showing high or low expression of the respective gene. (C) Receiver operating characteristic curves showing prognostic potential of bridge genes in HBV-related HCC. (D) Heat map depicting correlations of bridge genes. Red stands for positive correlation and blue stands for negative correlation.
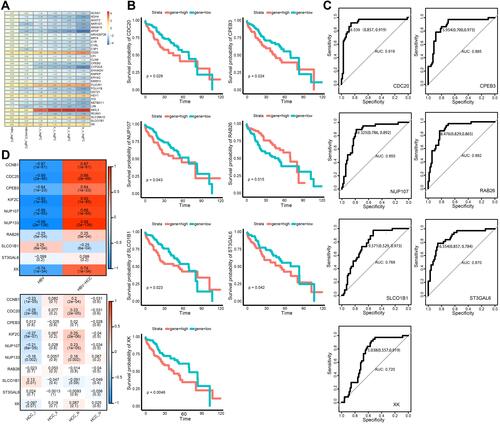
Figure 4 Pivot regulators of bridge genes within the module. Regulators interacting with multiple modules at least twice were identified as potential regulators of bridge genes. Green squares represent bridge genes in modules; blue hexagons, microRNAs; yellow triangles, long non-coding RNAs; pink arrows, transcription factors; and red circles, signaling pathways involved in bridge genes.
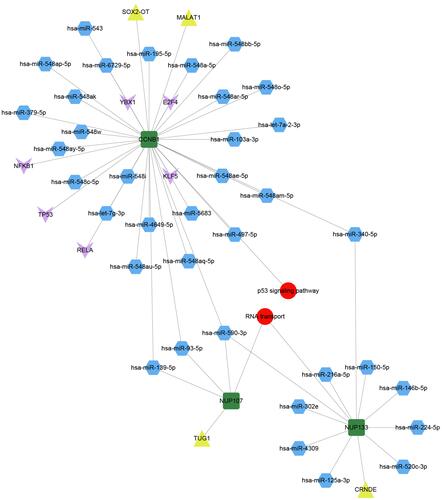
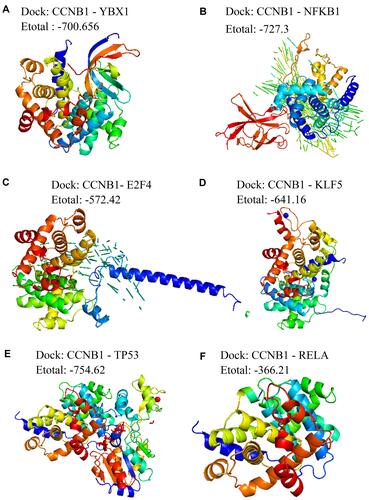
Figure 5 Molecular docking between pivot regulators and the bridge genes in the module. Docking of CCNB1 with (A) YBX1, (B) NFKB1, (C) E2F4, (D) KLF5, (E) TP53, or (F) RELA.