Figures & data
Figure 1 High glucose promoted EMT in ARPE-19 cells. ARPE-19 cells were cultured and exposed to 60 mM high glucose for 48h, and 5.5mM glucose-exposed ARPE-19 cells were used as the control. (A) The mRNA level of EMT markers (E-cadherin, ZO-1, vimentin, α-SMA) were detected by RT-PCR. **P < 0.01 versus the control group. (B and C) The protein level of EMT markers (E-cadherin, ZO-1, vimentin, α-SMA) were detected by Western blot. **P < 0.01 versus the control group. Data were shown as mean ± SD (n = 3). Data obtained from more than three repeated experiments were shown as mean ± SD.
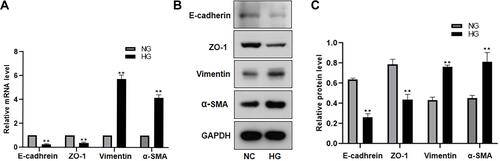
Figure 2 High glucose promoted the migration and proliferation of ARPE-19 cells, inhibited apoptosis, and increased the expression of SNHG1. ARPE-19 cells were cultured and exposed to 60 mM high glucose for 48h, and 5.5mM glucose-exposed ARPE-19 cells were used as the control. (A and B) The migration rate was measured by the migration distance after a scratch was made. The data are presented as the means ± SD, *p<0.05 compared with L-glucose as the control. (C) CCK-8 assay were applied to determine cell viability. **p<0.01 compared with L-glucose as the control. (D and E) Cell apoptosis rate was evaluated in flow cytometry analysis. **P <0.01 compared with L-glucose as the control. (F) qRT-PCR assay revealed SNHG1 expression. **P < 0.01 compared with L-glucose as the control. Data obtained from more than three repeated experiments were shown as mean ± SD.
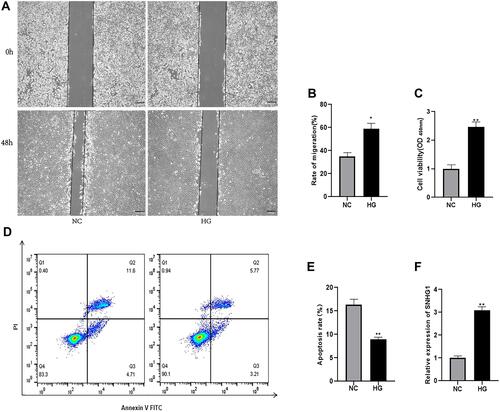
Figure 3 Knocking-down SNHG1 inhibited EMT in ARPE-19 cells induced by high glucose. ARPE-19 cells were transfected with SNHG1-specific siRNA (si-SNHG1) or a negative control siRNA (Si-NC) after exposure to 60 mM (high) glucose for 48 h. (A) qRT-PCR assay revealed SNHG1 expression. **P < 0.01 compared with Si-NC as the control. (B) The mRNA level of EMT markers (E-cadherin, ZO-1, vimentin, α-SMA) were detected by RT-PCR. ***P < 0.001 versus the control group. (C and D) The protein level of EMT markers (E-cadherin, ZO-1, vimentin, α-SMA) were detected by Western blot.*P < 0.05, **P < 0.01 and ***P < 0.001 compared with Si-NC as the control. Data obtained from more than three repeated experiments were shown as mean ± SD.
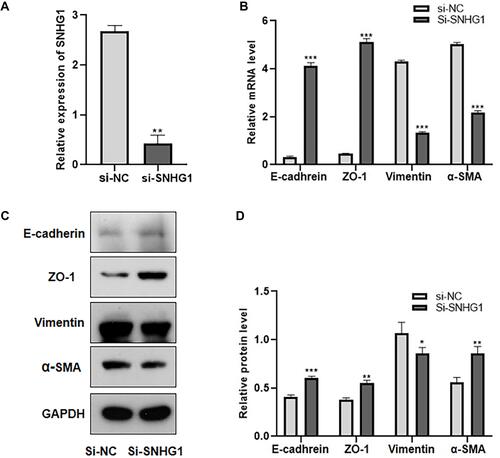
Figure 4 Knocking-down SNHG1 inhibited the migration and proliferation of ARPE-19 cells and promoted the apoptosis of ARPE-19 cells. ARPE-19 cells were transfected with SNHG1-specific siRNA (si-SNHG1) or a negative control siRNA (si-NC) after exposure to 60 mM (high) glucose for 48 h. (A and B) The migration rate was measured by the migration distance after a scratch was made. The data are presented as the means ± SD, ***p<0.001 compared with si-NC as the control. (C) CCK-8 assay were applied to determine cell viability. **p<0.01 compared with si-NC as the control. (D and E) Cell apoptosis rate was evaluated in flow cytometry analysis. **P <0.01 compared with si-NC as the control.
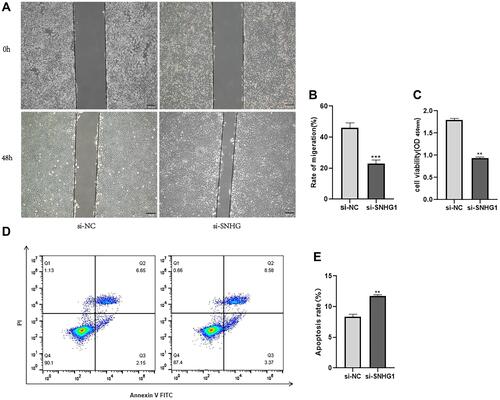
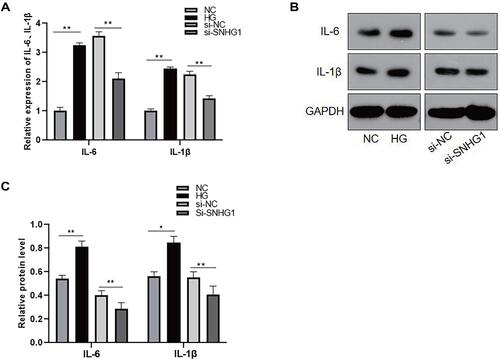
Figure 5 High glucose promoted the expression of proinflammatory cytokines, which was downregulated after SNHG1 knockdown. (A) The level of IL-6 and IL-1β were detected by ELASA. **P < 0.01 versus the control group. (B and C) The protein level of IL-6 and IL-1β were detected by Western blot. *P < 0.05 and**P < 0.01 versus the control group. Data obtained from more than three repeated experiments were shown as mean ± SD.