Figures & data
Figure 1 Adiposity (A) and kidney indices (B) of normal diet (ND)- and high fat style diet (HFSD)-fed rats with and without ovariectomy (OVX). Data are expressed as mean ± SEM (n = 12 per group). ****P < 0.001 vs. ND; #P < 0.05 or ####P < 0.001 vs. OVX-ND.
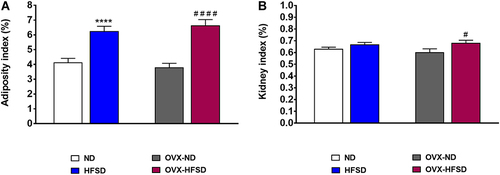
Figure 2 Fasting blood glucose (A) and mean blood pressure (B) of high-fat style diet (HFSD)-fed intact and ovariectomized rats (OVX). Data are expressed as mean ± SEM (n = 12 per group). ####P < 0.001 vs. OVX-ND, δδP < 0.01 or δδδδP < 0.001 vs. HFSD, ϕϕϕϕP < 0.001 vs. week 0 of the corresponding group. FBG, fasting blood glucose; MBP, mean blood pressure.
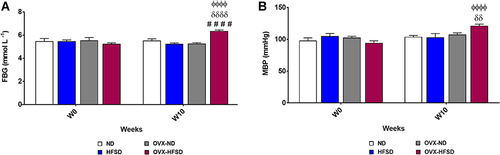
Figure 3 Mesangial expansion (A) and mononuclear cell infiltration (B) of PAS stained kidneys of high fat style diet (HFSD)-fed rats, with and without ovariectomy (OVX) (n = at least 4 per group). Red arrow indicates the mononuclear cell infiltration. Magnification: 400×.
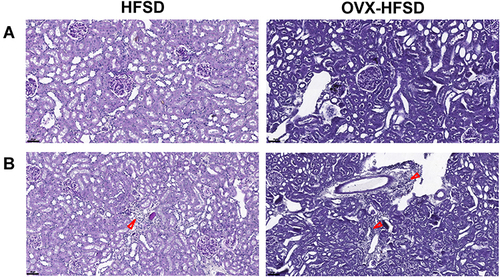
Figure 4 Hepatic steatosis (H&E stained) (A), lipid accumulation (Oil Red O stained) (B), lobular infiltrates (C), hepatocytes ballooning (D) in H&E stained liver of high fat style diet (HFSD)-fed rats, with and without ovariectomy (OVX) (n = at least 4 per group). Magnification: 8× (A), 10× (B). Yellow color closed arrow indicates microvesicular steatosis and blue color closed arrow indicates macrovesicular steatosis.
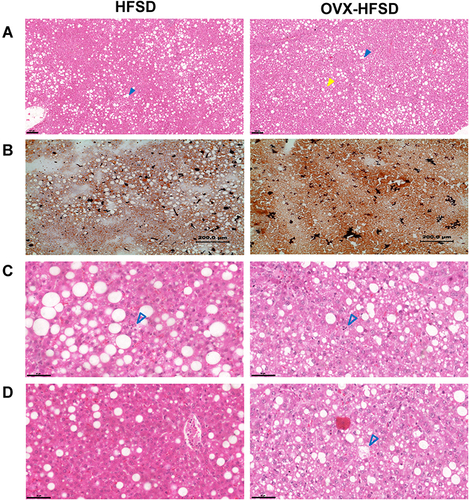
Figure 5 Quantification of mean pixel intensities of Oil Red O staining in liver (A) and liver index (B) of normal diet (ND)- and high fat style diet (HFSD)-fed rats with and without ovariectomy (OVX) (n = 12 per group). **P < 0.01 or ****P < 0.001 vs. ND; ####P < 0.001 vs. OVX-ND; δδP < 0.01 or δδδP < 0.005 vs. HFSD.
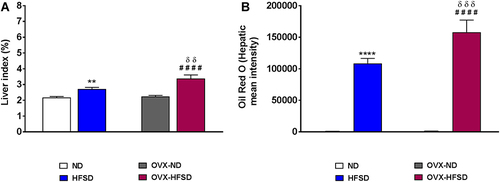
Figure 6 Immunohistochemical staining of IL-6 in kidneys in the cortex, outer medulla and inner medulla regions (A) and quantification of mean pixel intensities of kidney cortical IL-6 staining (B) of normal diet (ND)- and high fat style diet (HFSD)-fed rats, with and without ovariectomy (OVX) (n = 12 per group) at 40X magnification. Dark red arrow indicates the positive immunohistochemical stainings. *P < 0.05 or **P < 0.01 vs. ND; ####P < 0.001 vs. OVX-ND; δδδδP < 0.001 vs. HFSD.
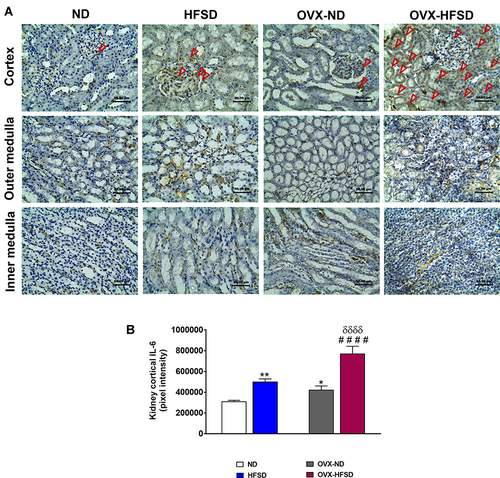
Figure 7 Immunohistochemical staining of TNF-α in kidneys in the cortex, outer medulla and inner medulla regions (A) and quantification of mean pixel intensities of kidney cortical TNF- α staining (B) of normal diet (ND)- and high fat style diet (HFSD)-fed rats, with and without ovariectomy (OVX) (n = 12 per group) at 40X magnification. Dark red arrow indicates the positive immunohistochemical stainings. ****P < 0.001 vs. ND; ####P < 0.001 vs. OVX-ND; δδδδP < 0.001 vs. HFSD.
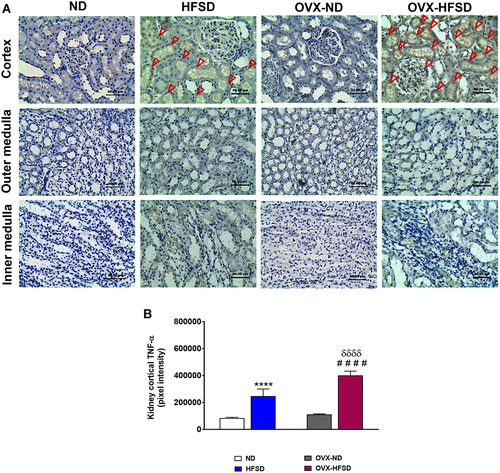
Figure 8 Immunohistochemical staining of MCP-1 in kidneys at the cortex, outer medulla and inner medulla regions (A) and quantification of mean pixel intensities of kidney cortical MCP-1 staining (B) of normal diet (ND)- and high fat style diet (HFSD)-fed rats, with and without ovariectomy (OVX) (n = 12 per group) at 40X magnification. Dark red arrow indicates the positive immunohistochemical stainings. **P < 0.01 vs. ND; ####P < 0.001 vs. OVX-ND; δδδδP < 0.001 vs. HFSD.
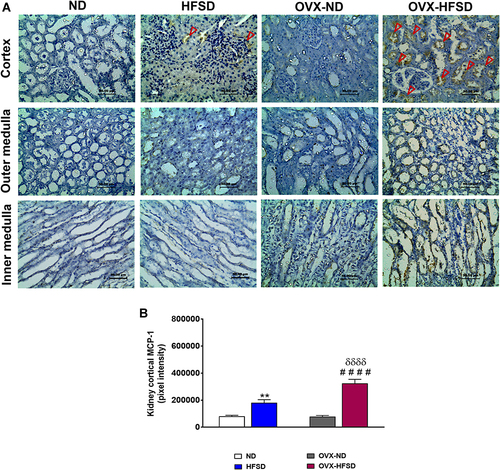
Figure 9 Double immunofluorescence staining of p- NF-κB (indicated in green color) and NF-κB (indicated in red color) (A) in kidneys, and quantification of mean pixel intensities of kidney cortical p-NF-κB (B) and NFκB (C) of normal diet (ND)- and high fat style diet (HFSD)-fed rats, with and without ovariectomy (OVX) (n = 12 per group) at 40X magnification. p-NF-κB, phosphorylated nuclear factor kappa-B; NF-κB, total nuclear factor kappa-B. *P < 0.05, **P < 0.01 or ***P < 0.005 vs. ND; ####P < 0.001 vs. OVX-ND.
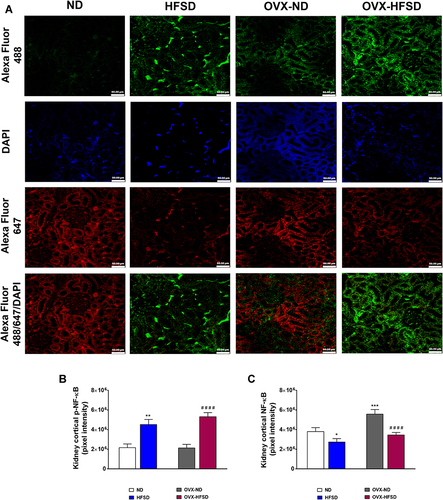
Figure 10 Immunohistochemical staining of IL-6 (A), TNF-α (B) and MCP-1 in liver (C) and quantification of mean pixel intensities of hepatic IL-6 (D), TNF-α (E) and MCP-1 (F) staining of normal diet (ND)- and high fat style diet (HFSD)-fed rats, with and without ovariectomy (OVX) (n = 12 per group) at 40X magnification. Dark red arrow indicates the positive immunohistochemical stainings. **P < 0.01 or ****P < 0.001 vs. ND; ##P < 0.01 or ####P < 0.001 vs. OVX-ND; δP < 0.05 vs. HFSD.
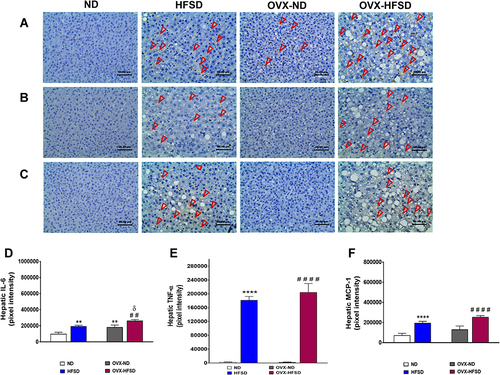
Figure 11 Immunofluorescence staining of M1 (indicated in red color fluorescent) (A), M2 (indicated in green color fluorescent) (B) macrophages in kidneys, and quantification of mean pixel intensities of kidney cortical M1 (C) and M2 markers (D) of normal diet (ND)- and high fat style diet (HFSD)-fed rats, with and without ovariectomy (OVX) (n = 12 per group) at 40X magnification. ****P < 0.001 vs. ND; ####P < 0.001 vs. OVX-ND; δδδδP < 0.001 vs. HFSD.
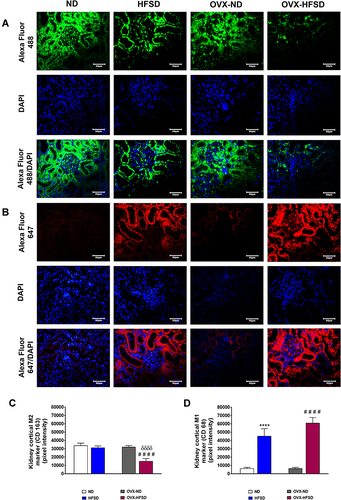
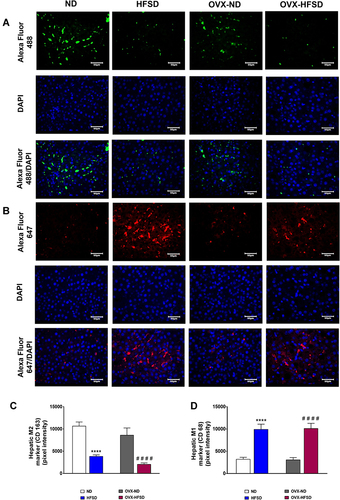
Figure 12 Immunofluorescence staining of M1 (indicated in red color) (A), M2 (indicated in green color) (B) macrophages in liver, and quantification of mean pixel intensities of hepatic M1 (C) and M2 markers (D) of normal diet (ND)- and high fat style diet (HFSD)-fed rats, with and without ovariectomy (OVX) (n = 12 per group) at 40X magnification. ****P < 0.001 vs. ND; ####P < 0.001 vs. OVX-ND.