Figures & data
Figure 1 The expression, distribution, and trajectory of exosomal miR-130a-3p. (A) Cell experiment grouping. (B) The expression of exosomal miRNA in the control group and in the activation group in which miR-130a-3p expression is significantly high. (C and D) The distribution of exosomal miR-130a-3p. (E) Dynamic tracing of exosomes and exosomal miRNAs. DilC-18 was used to label exosome phospholipid bilayers, and AO was used to label exosomal miRNAs. Red fluorescence represents exosomes and exosomal miRNAs, and blue fluorescence represents the PSC nucleus (***p <0.001, **p <0.01).
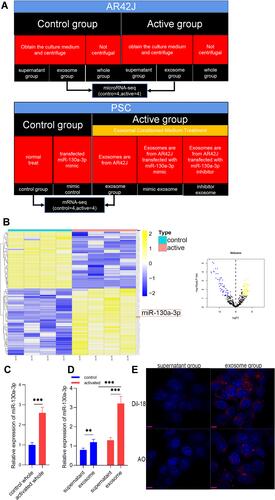
Figure 2 Detection of the various indicators in each group of PSCs at the cellular level via PCR or Western blot (WB). (A) PCR detection of the relative expression level of miR-130a-3p in each group of PSCs. (B) PCR detection of α-SMA expression levels in each group of PSCs. (C) PCR detection of the collagen I expression level in each group of PSCs. (D) PCR detection of the collagen ш expression level in each group of PSCs. (E and F) WB detection of the α-SMA, collagen I, and collagen III protein levels in PSCs (***p <0.001, **p <0.01, *p <0.05, NS denotes no significant difference).
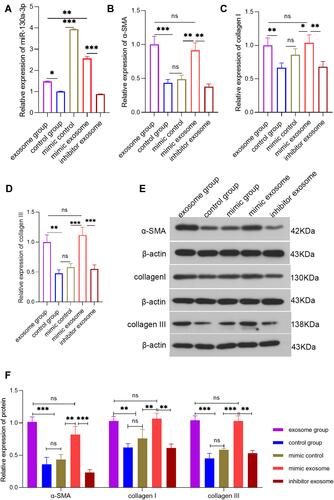
Figure 3 PCR or WB detection of the various indicators in pancreatic tissue from each group at the animal level. (A) PCR detection of the relative miR-130a-3p expression level in pancreatic tissue from each group. (B) PCR detection of the α-SMA expression level in pancreatic tissues from each group. (C) PCR detection of the collagen I expression level in pancreatic tissues from each group. (D) PCR detection of the collagen ш expression level in pancreatic tissues from each group. (E and F) WB detection of the α-SMA, collagen I, and collagen ш protein levels in pancreatic tissue (***p <0.001, **p <0.01, *p <0.05, NS denotes no significant difference).
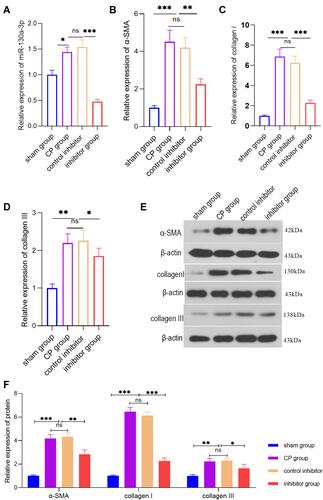
Figure 4 (A and B) H&E and Masson staining of pancreatic tissues from each group. (C–E) Immunohistochemistry of α-SMA, collagen I, and collagen ш in pancreatic tissues from each group. (F) Masson staining of fibrosis areas in pancreatic tissues from each group. (G) The relative expression levels of α-SMA, collagen I, and collagen ш in pancreatic tissues from each group (***p <0.001, **p <0.01, NS denotes no significant difference).
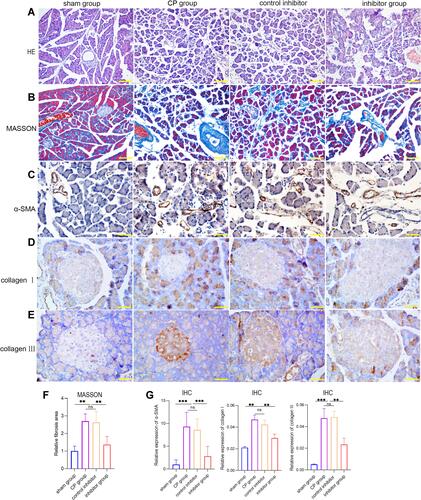
Figure 5 Knockdown of miR-130a-3p not only improves pancreatic endocrine and exocrine functions but also protects endothelial cells. (A) ELISA detection of C-peptide in serum from mice in each group. (B) ELISA detection of hyaluronic acid (HA) in serum from mice in each group. (C) DNS method for calculation of the β-amylase activity in serum from mice in each group (***p <0.001, **p <0.01, *p <0.05, NS denotes no significant difference).
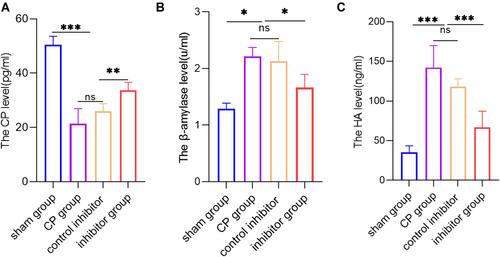
Figure 6 miR-130a-3p promotes pancreatic fibrosis by inhibiting PPAR-γ expression. (A) mRNA expression before and after PSC activation. (B) Based on the STRING database, a protein-protein interaction (PPI) network map was plotted for significantly differentially expressed genes, and a centrality analysis of the PPI network through CytoNCA was conducted to obtain 10 essential proteins (hub genes). (C) Venn diagram showing miR-130a-3p target genes and 10 essential protein mRNAs (hub genes). (D) Dual-luciferase reporter gene assay for determination of relative PPAR-γ activity. (E and F) The relative expression levels of PPAR-γ mRNA and protein detected in cells. (G and H) The relative expression levels of PPAR-γ mRNA and protein detected in tissues. (I) The quantification of the density of the blotting bars of PPARγ in cell. (J) The quantification of the density of the blotting bars of PPARγ in pancreatic tissue (***p <0.001, **p <0.01, *p <0.05, NS denotes no significant difference).
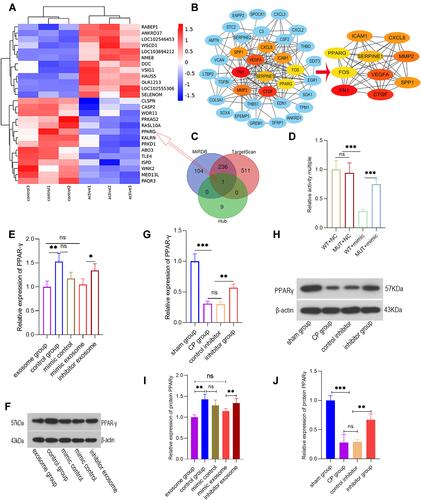
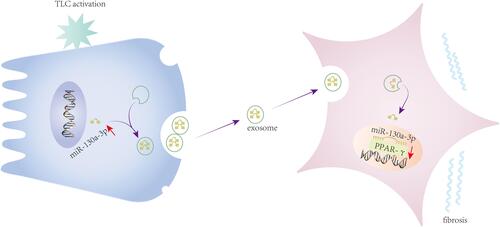
Figure 7 After acinar cell activation, the cells’ secretion of exosomal miR-130a-3p was upregulated, and exosomal miR-130a-3p promoted PSC activation and collagen formation by inhibiting stellate cell PPAR-γ.