Figures & data
Table 1 Real-Time PCR Primer Sequences
Figure 1 Rotenone dose-dependently induces LC/NE neurodegeneration and microglial activation in mice. (A) Mice were injected with the indicated dose of rotenone for 3 weeks. Immunohistochemistry with an anti-TH antibody was performed to stain NE neurons in the LC of mice, and representative images are presented. (B) Quantification of the number of THir neurons. (C) Immunohistochemistry with an anti-Iba-1 antibody was performed to stain microglial cells in the LC of mice, and representative images are presented. (D) Quantification of the density of Iba-1 immunostaining. Results were mean ± SEM from six mice for each group and were analyzed by one-way ANOVA (THir neurons counts: F(2,15) = 50.221, P = 0.000; Iba-1 density: F(2,15) = 8.158, P = 0.004; post hoc analysis by Tukey’s multiple comparisons test). **P<0.01; Scale bar = 100 μm.
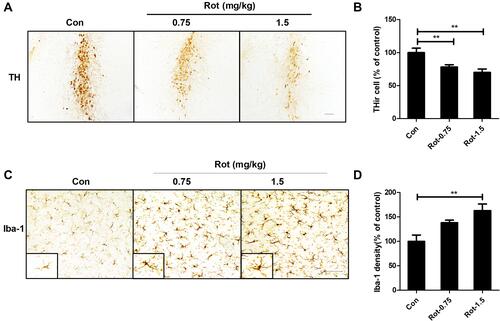
Figure 2 Rotenone time-dependently induces microglial activation and LC/NE neurodegeneration in mice. (A) Microglial cells and LC/NE neurons from mice at the indicated time points after rotenone treatment were immunostained with anti-Iba-1 and anti-TH antibodies, respectively, and representative images are shown. (B) Quantification of the density of Iba-1 immunostaining. (C) Quantification of the number of THir neurons. Results were mean ± SEM from four mice for each group and were analyzed by one-way ANOVA (Iba-1 density: F(3,12) = 21.464, P = 0.000; THir neurons counts: F(3,12) = 8.849, P = 0.002; post hoc analysis by Tukey’s multiple comparisons test). (D) The expression levels of Iba-1 and TH in the brainstem of mice were determined by Western blotting with specific antibodies, and representative blots are shown. (E and F) Quantification of the band densities of Iba-1 (E) and TH (F). Results were mean ± SEM from four mice for each group and were analyzed by one-way ANOVA (Iba-1: F(3,12) = 6.744, P = 0.006; TH: F(3,12) = 20.506, P = 0.000; post hoc analysis by Tukey’s multiple comparisons test). *P<0.05, **P<0.01; Scale bar = 100 μm.
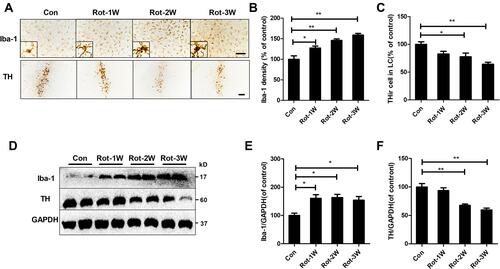
Figure 3 Microglial activation mediates rotenone-induced LC/NE neuronal loss in mice. (A) After 3 weeks of PLX3397 treatment, microglial cells in the LC of mice were immunostained with an anti-Iba-1 antibody, and the number of Iba-1+ microglia was quantified. (B) After 3 weeks of rotenone treatment with or without minocycline, microglial cells in the LC of mice were immunostained with an anti-Iba-1 antibody, and the density of Iba-1 in the brainstem was quantified. Results were mean ± SEM from three mice for each group and were analyzed by one-way ANOVA (Iba-1+ counts: F(3,8) = 251.733, P = 0.006; Iba-1 density: F(2,6) = 10.57, P = 0.011; post hoc analysis by Tukey’s multiple comparisons test). (C) Immunohistochemistry with an anti-TH antibody was performed to stain LC/NE neurons of rotenone-intoxicated mice with or without PLX3397 and minocycline, and representative images are shown. (D) Quantification of the number of THir neurons. Results were mean ± SEM from six mice for each group and were analyzed by one-way ANOVA (F(3,20) = 62.255, P = 0.000; post hoc analysis by Tukey’s multiple comparisons test). *P<0.05, **P<0.01; Scale bar = 100 μm.
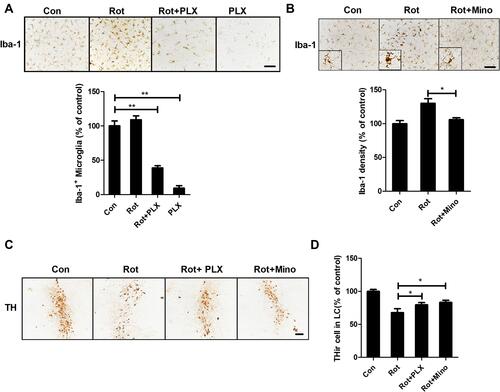
Figure 4 CR3 contributes to microglial activation in rotenone-intoxicated mice. (A) The expression of CR3 in the brainstem was determined by Western blotting, and representative blots are shown. (B) Quantification of the band densities of the CR3 blots. Results were mean ± SEM from four mice for each group and were analyzed by t test (t = −9.098, V = 6, P = 0.000). (C) Real-time PCR was performed to detect the gene expression level of CR3 in the brainstem of mice. Results were mean ± SEM from six mice for each group and were analyzed by Wilcoxon (W = 22, Z = −2.722, P = 0.006). (D) Immunohistochemistry with an anti-Iba-1 antibody was performed to stain microglial cells in the LC of rotenone-intoxicated WT and CR3−/- mice, and representative images are shown. (E) Quantification of the density of Iba-1 immunostaining. Results were mean ± SEM from six mice for each group and were analyzed by two-way ANOVA (F(3,20) = 11.544, P = 0.000, post hoc analysis by Tukey’s multiple comparisons test). **P<0.01; Scale bar = 100 μm.
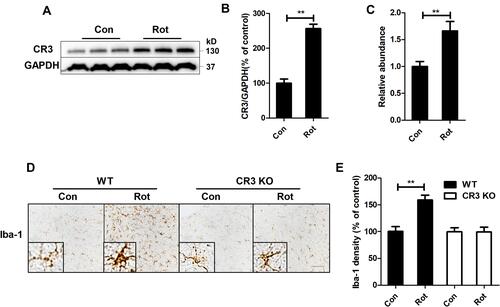
Figure 5 Genetic deletion of CR3 reverses the rotenone-induced imbalance of microglial M1/M2 polarization in mice. (A) Real-time PCR was performed to detect the mRNA levels of iNOS, TNFα and IL-1β in the brainstem of WT and CR3−/- mice. Results were mean ± SEM from six mice for each group and were analyzed by two-way ANOVA (iNOS: F(3,20) = 20.362, P = 0.000; TNFα: F(3,20) = 25.809, P=0.000; IL-1β: F(3,20) = 20.25, P = 0.000; post hoc analysis by Tamhane’s T2 multiple comparisons test). (B) The mRNA levels of Arg-1, CD206 and YM-1 in the brainstem of WT and CR3−/- mice were determined by real-time PCR. Results were mean ± SEM from six mice for each group. Data of Arg-1 were analyzed by Kruskal Wallis H-test (H(3) = 12.767, P = 0.005) and results of CD206 and YM-1 were analyzed by two-way ANOVA (CD206: F(3,20) = 2.235, P = 0.116, YM-1: F(3,20) = 1.768, P = 0.186). *P<0.05, **P<0.01.
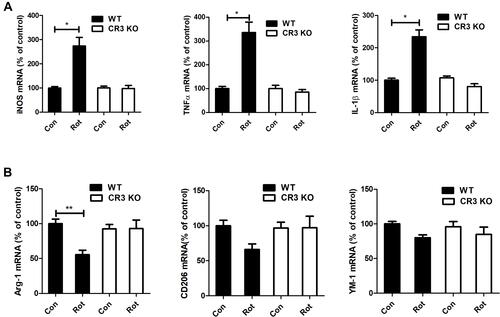
Figure 6 LA-1 abrogates rotenone-induced activation and M1 polarization of microglia in mice. (A) Immunohistochemistry with an anti-Iba-1 antibody was performed to stain microglial cells in the LC of rotenone-intoxicated mice with or without LA-1 treatment, and representative images are shown. (B) Quantification of the density of Iba-1 immunostaining. Results were mean ± SEM from five mice for each group and were analyzed by one-way ANOVA (F(3,16) = 10.109, P = 0.001). (C) The mRNA levels of iNOS, TNFα and IL-1β in the brainstem of rotenone-treated mice with or without LA-1 treatment were determined by real-time PCR. Results were mean ± SEM from five mice for each group and were analyzed by one-way ANOVA (iNOS: F(3,16) = 5.661, P = 0.008; TNFα: F(3,16) = 7.439, P = 0.002; IL-1β: F(3,16) = 3.589, P = 0.037; post hoc analysis by Tukey’s multiple comparisons test). (D) The mRNA levels of Arg-1, CD206 and YM-1 in the brainstem of rotenone-treated mice with or without LA-1 treatment were determined by real-time PCR. Results were mean ± SEM from five mice for each group and were analyzed by one-way ANOVA (Arg-1: F(3,16) = 12.575, P = 0.000, post hoc analysis by Tukey’s multiple comparisons test; CD206: F(3,16) = 6.956, P=0.003, post hoc analysis by Tamhane’s T2 multiple comparisons test; YM-1: F(3,16) = 10.109, P=0.001, post hoc analysis by Tukey’s multiple comparisons test). *P<0.05, **P<0.01; Scale bar = 100 μm.
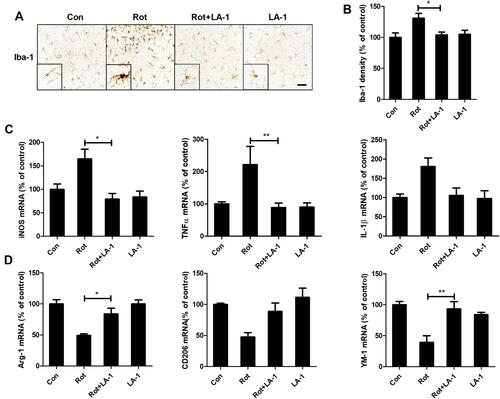
Figure 7 Genetic deletion of CR3 or LA-1 treatment mitigates oxidative stress in rotenone-intoxicated mice. (A) The MDA and GSH contents were determined in the brainstem of WT and CR3−/- mice after rotenone treatment by using commercial kits. Results were mean ± SEM from three mice for each group and were analyzed by two-way ANOVA (MDA: F(3,8) = 34.604, P = 0.000; GSH: F(3,8) = 37.129, P = 0.000; post hoc analysis by Tukey’s multiple comparisons test). (B) The MDA and GSH contents were determined in the brainstem of rotenone-treated mice with or without LA-1 treatment by using commercial kits. Results were mean ± SEM from four mice for each group and were analyzed by one-way ANOVA (MDA: F(3,12) = 12.753, P = 0.000; GSH: F(3,12) = 10.373, P = 0.001; post hoc analysis by Tukey’s multiple comparisons test). *P<0.05, **P<0.01.
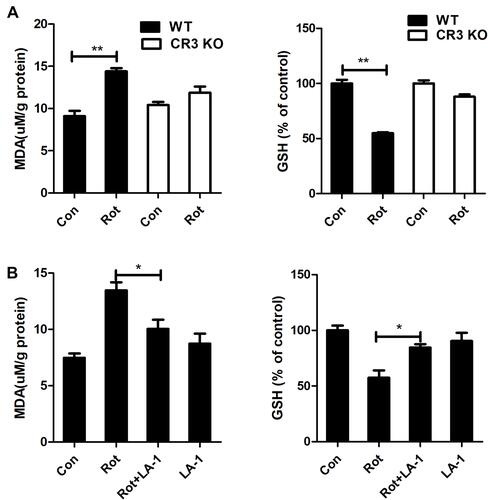
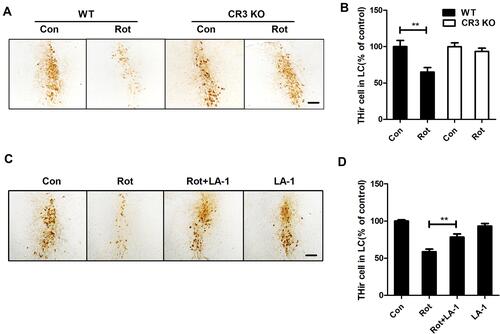
Figure 8 CR3 deficiency or LA-1 treatment alleviates rotenone-induced degeneration of LC/NE neurons in mice. (A) Immunohistochemistry with an anti-TH antibody was performed to stain LC/NE neurons of rotenone-intoxicated WT and CR3−/- mice, and representative images are shown. (B) Quantification of the number of THir neurons. Results were mean ± SEM from five to six mice for each group and were analyzed by two-way ANOVA (F(3,19) = 6.923, P = 0.002, post hoc analysis by Tukey’s multiple comparisons test). (C) Immunohistochemistry with an anti-TH antibody was performed to stain LC/NE neurons of rotenone-intoxicated mice with or without LA-1 treatment, and representative images are shown. (D) Quantification of the number of THir neurons. Results were mean ± SEM from five mice for each group and were analyzed by one-way ANOVA (F(3,16) = 27.527, P = 0.000, post hoc analysis by Tukey’s multiple comparisons test). **P<0.01; Scale bar = 100 μm.