Figures & data
Figure 1 Histopathological changes of the two group (× 400). (A) Colonic mucosal histology of normal controls (× 400); (B) Colonic mucosal histology of IBS-D patients (× 400). The positive cells were purple and blue. Hematoxylin-eosin (HE) was used for staining in the detection. IBS-D: Diarrhea-predominant irritable bowel syndrome.
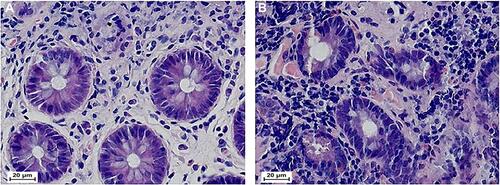
Figure 2 Immunohistochemical results of tryptase-positive MC (× 400). (A): Tryptase-positive mast cell (MC) in the normal subject (× 400); (B) Tryptase-positive MC in the patient with IBS-D (× 400). The positive cells manifested brown or yellow stained.
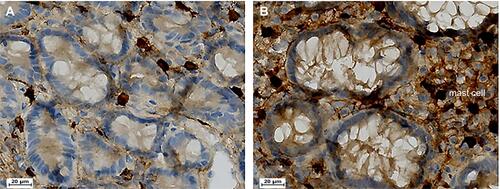
Figure 3 Immunohistochemical results of NPS, NPY, NPY2R and PAR-2 (× 400). (A) NPS in the normal group (× 400); (B) NPS in the IBS-D group (× 400); (C) NPY in the normal group; (D) NPY in the IBS-D group (× 400); (E) NPY2R in the normal group (× 400); (F) NPY2R in the IBS-D group (× 400); (G) PAR-2 in the normal group (× 400); (H) PAR-2 in the IBS-D group (× 400).
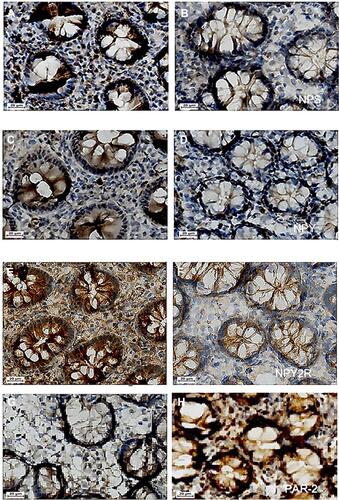
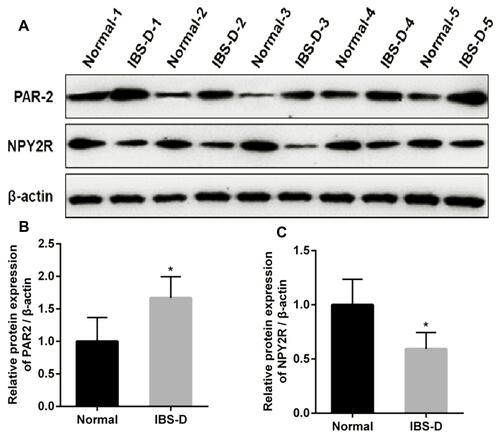
Figure 4 Expression of PAR-2 and NPY2R in the two group. (A) NPY2R and PAR-2 protein bands detected by Western blot; (B) The expression of PAR-2 in the IBS-D group was significantly higher than that in the normal group; (C) The expression of NPY2R in the IBS-D group was significantly lower than that in the normal group.*represents p < 0.05 vs Normal.