Figures & data
Figure 1 Representative photomicrographs of immunohistochemistry staining of ACE2 in human lung tissues. (A) alveolar epithelial cells (red arrow); (B) vascular endothelial cells (red arrow); (C) small airway epithelial cells (red arrow) and smooth muscles (yellow arrow); (D) alveolar macrophages (red arrow).
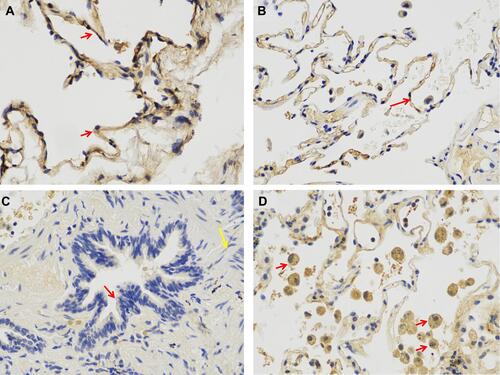
Figure 2 The influence of smoking history (A), gender (B), hypertension (C), and blood types (D) to ACE2 expression in lung tissue. Individual values, mean, and standard deviation are shown. *P <0.05.
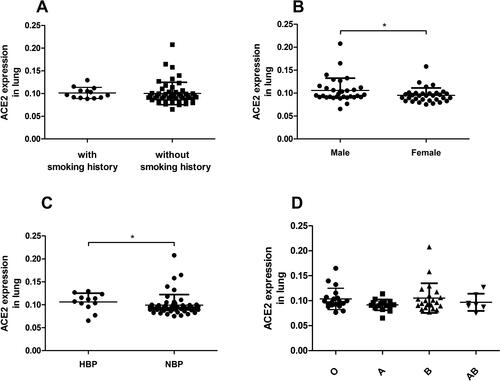
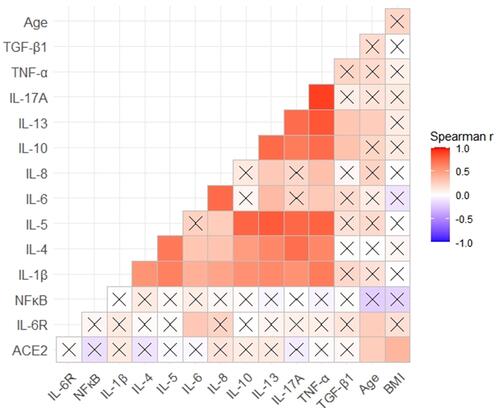
Figure 3 Spearman correlation coefficient matrix and Spearman rank correlation tests for ACE2 and clinical features. n = 64. ACE2 was positively correlated with weight (r = 0.43, P<0.001), BMI (r = 0.38, P = 0.002), height (r = 0.27, P = 0.034), age (r = 0.26, P = 0.040) and macrophages in lung (r = 0.27, P = 0.030), and was negatively correlated with peripheral eosinophils (r = −0.30, P = 0.017). ACE2 was not correlated with FENO/CANO, spirometric variables, lymphocytes and neutrophils (peripheral or in lung tissue), eosinophils in lung, platelets, or the percentages of pneumonectasis (P>0.05, for all). A cross indicates no statistical significance. P values are shown in Supplementary Table S1.
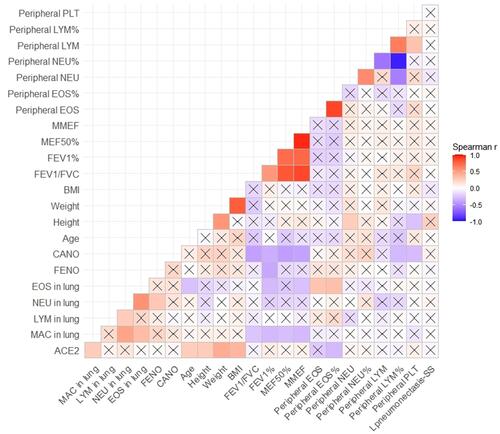
Figure 4 Correlation between ACE2 expressions and (A) weight, (B) BMI, (C) height, (D) age, (E) macrophages in lung and (F) peripheral eosinophils (%). n = 64; (A) r = 0.43 (95% CI, 0.20 to 0.61), P < 0.001; (B) r = 0.38 (95% CI, 0.14 to 0.58), P = 0.002; (C) r = 0.27 (95% CI, 0.01 to 0.49), P = 0.034; (D) r = 0.26 (95% CI, 0.01 to 0.48), P = 0.040; (E) r = 0.27 (95% CI, 0.02 to 0.49), P = 0.030; (F) r = −0.299 (95% CI, −0.51 to −0.05), P = 0.017.
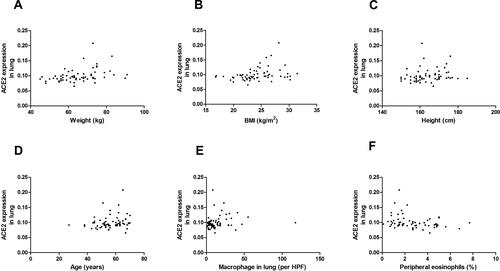
Figure 5 Correlation of ACE2 and age with pro-inflammation cytokines in the biopsied tissues. n = 64. No statistically significant correlation was found between ACE2 and any of the pro-inflammation cytokines analyzed in lung tissue (IL-6R, TNF-α, IL-17A, IL-13, IL-10, IL-8, IL-6, IL-4, IL-1β, NF-κB: P>0.05, for all). Age was found positively correlated with IL-6R and IL-13 in lung tissue. (r =0.26, P <0.05 for both).