Figures & data
Table 1 Differentially expressed proteins (DEPs) identified by iTRAQ and 2DE in TKR/UKR blood plasma samples compared to HCs
Figure 1 Two-dimensional gel electrophoresis (2DE) of plasma proteins. Representative 2DE gel images of plasma proteins showing differentially expressed protein spots in TKR (gel 1), UKR (gel 2), and HCs (gel 3), marked with arrows and numbered 1–15. Protein spots were excised from the protein gel and identified by liquid chromatography with tandem mass spectrometry.
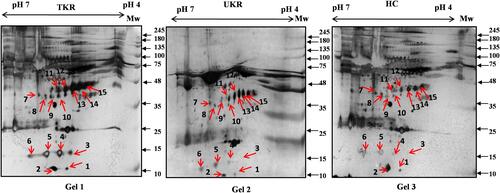
Figure 2 Venn diagrams of distribution of differentially expressed proteinsidentified in TKR and UKR. (A) Upregulated DEPs and their distribution among TKR and UKR: 30 proteins were upregulated in TKR and 23 in UKR patients, while 21 were common to both TKR and UKR patients. (B) Similarly, 13 proteins in TKR and 20 proteins in UKR patients were downregulated and ten common to both TKR and UKR patients compared to healthy controls.
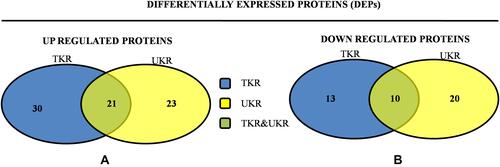
Figure 3 Validation of haptoglobin (Hp) expression in plasma. (A) Representative Western blot image of pooled plasma samples (TKR = 12, UKR = 12, HCs = 12) developed using anti-Hp antibody to detect Hpα. Hpα protein expression was normalized with total protein (lower panel) with Ponceau staining of membrane. (B) Densitometric analysis showing 1.5 fold upregulated Hpα in TKR (pP=0.0021) and 1.4-fold in UKR (pP=0.005) compared to HCs. Analysis was done using mean values of three independent experiments. (C) ELISA results showing Hp concentrations in blood plasma of TKR (n=40), UKR (n=11) and HCs (n=17). Average Hp concentration was found lowered by 1,417 ng/μL in TKR and 1,584 ng/μL compared to 1,655 ng/μL in HC plasma samples. The average fold change was found to be 0.8 (P=0.0003) and 0.95 (P=0.05) in TKR and UKR compared to HCs, respectively. TKR also showed 0.89-fold (P=0.05) lower levels of Hp than UKR.
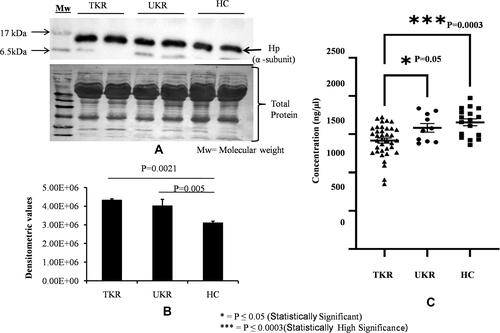
Figure 4 Native-gel analysis and autoantibody detection against haptoglobin (Hp). (A) Representative glycoprotein-stained image of Western blot after running native PAGE using purified native Hp protein (tetramer) by immunoprecipitation from plasma samples indicated low levels of Hp tetramer (120 kDa) in TKR and UKR compared to HCs. (B) Densitometric analysis of glycosylated Hp native band shows lower levels of Hp tetramer in TKR (0.69-fold) and UKR (0.83-fold) than HCs. (C) Western blot was carried out after running SDS-PAGE using IP-eluted purified Hp protein and using blood plasma as source of primary antibodies followed by incubation with antihuman secondary antibody. The image represents increased levels of autoantibodies against Hpβ in TKR and UKR plasma compared to HCs. (D) Densitometric analysis of Western blot indicating subsequent increased level of autoantibodies (1.57-fold in TKR and 1.31-fold in UKR) against Hpβ compared to HC plasma samples.
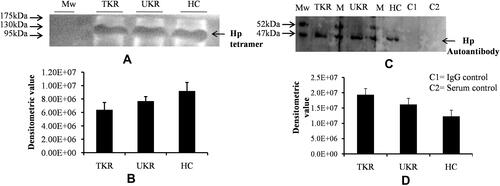
Figure 5 Ubiquitination of haptoglobin (Hp) by Western blot analysis. (A) Representative Western blot image showing that there were decreased levels of ubiquitinated Hpβ in TKR/UKR compared to HCs. Ubiquitination of Hpβ was detected using antiubiquitin antibody after immunoprecipitated Hp had been separated on SDS-PAGE followed by Western blot. (B) Densitometry analysis showing decreased ubiquitination of Hp in TKR (0.22-fold) and UKR (0.37-fold) compared to HCs. (C) Silver-stained image of gel after running SDS-PAGE using purified Hp, indicating lower levels of Hpβ in TKR and UKR patients than HCs. (D) Densitometry analysis of gel image for Hpβ showing lower levels of Hpβ in TKR (0.47-fold) and UKR (0.41-fold) than HCs. (E) Ubiquitination percentages of Hpβ in TKR, UKR, and HCs, showing 45.85% Hpβ) ubiquitinated in TKR and 86.48% in UKR compared to 96.92% in HCs.
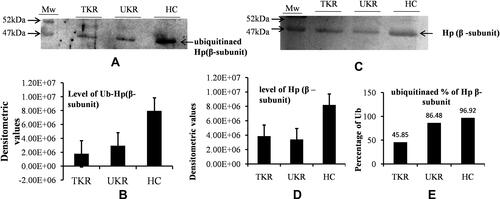
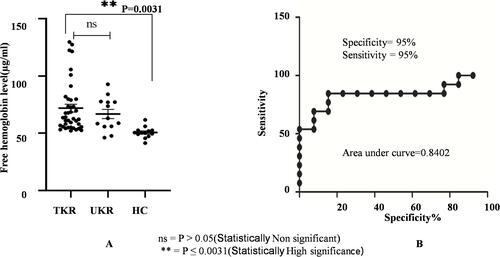
Figure 6 Free hemoglobin plasma–level analysis. (A) Circulating free hemoglobin in plasma was quantified in TKR (n=39), UKR (n=13), and HCs (n=13) using ELISA. The dot plot shows increased circulating free hemoglobin in TKR and UKR blood plasma compared to HCs. Free hemoglobin in TKR was found 71 μg/mL and 66 μg/mL in UKR compared to 50 μg/mL basal level in HCs. (B) ROC plot indicating individual protein abundance in each group with area under curve (AUC) of 0.8402 with 95% sensitivity and 95% specificity between the groups.