Figures & data
Table 1 Primers for RT-PCR
Table 2 OMLDT Patients Serum ET-1, Ang-1, Ang-2, Cre, BUN and Urine PCX Levels (P50 (P25, P75))
Figure 1 Relationships between ET-1, Ang-1 and BUN (before treatment). OMLDT patients’ serum ET-1 was negatively correlated with Ang-1 (A). There are no significant correlations between serum ET-1 and BUN (B). Ang-1 was negatively correlated with BUN (P<0.05) (C).
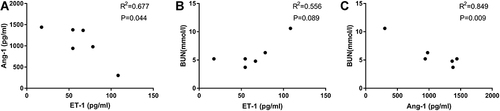
Figure 2 Protein levels of ET-1 and Ang-1. (A) showed the Western blot results of renal ET-1 and Ang-1 expression levels. (B and C) showed the optical density values of ET-1 and Ang-1, respectively. Compared to solvent control group, ET-1 significantly increased but Ang-1 decreased in TCE sensitized positive group. *P<0.05.
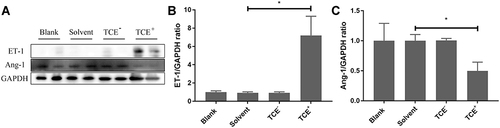
Figure 3 Urinary Cys-c, PCX, Cre and UN levels. Figure 3 shows the urinary levels of Cys-c, PCX, Cre and UN, respectively. Compared to solvent control group, urine levels of Cre, UN, Cys-c and PCX were significantly increased in TCE+BQ123 sensitized positive group; compared to TCE+BQ123 sensitized positive group, urine levels of Cre, UN, Cys-c and PCX were significantly increased in TCE sensitized positive group. *P<0.05.
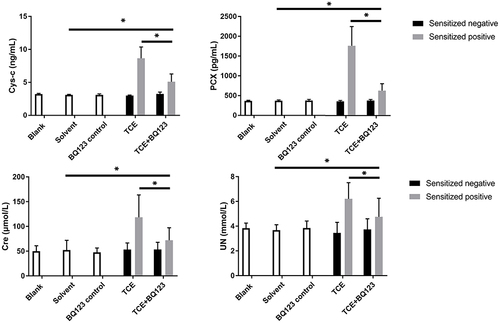
Figure 4 Protein levels of TNF-α and MCP-1. (A) showed the Western blot results of renal TNF-α and MCP-1. (B and C) showed the optical density values of TNF-α and MCP-1, respectively. Compared to solvent control group, MCP-1 and TNF-α were significantly decreased in TCE sensitized positive mice. But BQ123 reduced the expression of MCP-1 and TNF-α in TCE+BQ123 sensitized positive group compared to TCE sensitized positive group. *P<0.05.
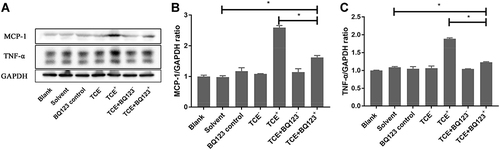
Figure 5 Protein levels of Fas, Fas/L, Bax, Bad, pro-caspase-3 and cleaved- caspase-3. (A) showed the Western blot results of renal Fas, Fas/L, Bax, Bad, pro-caspase-3 and cleaved- caspase-3. (B–G) showed the optical density values of Fas, Fas/L, Bax, Bad, pro-caspase-3 and cleaved- caspase-3, respectively. Compared to solvent control group, Fas, Fas/L, Bax, Bad, pro-caspase-3 and cleaved- caspase-3 protein levels were significantly increased in TCE sensitized positive group (P<0.05). But BQ123 downregulated them in TCE+BQ123 sensitized positive group compared to TCE sensitized positive group (P<0.05). *P<0.05.
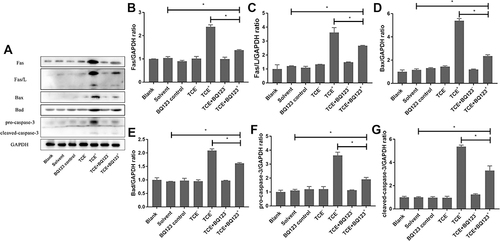
Figure 6 Protein levels of PI3K, pAKT, eNOS, pBad and Bcl-2. (A) showed the Western blot results of renal PI3K, pAKT, eNOS, pBad and Bcl-2. (B–F) showed the optical density values of PI3K, pAKT, eNOS, pBad and Bcl-2, respectively. Compared to solvent control group, PI3K, pAKT, eNOS, pBad and Bcl-2 protein levels were significantly decreased in TCE sensitized positive group (P<0.05), but increased in TCE+BQ123 sensitized positive group by treating with BQ123 compared to TCE sensitized positive group (P<0.05). *P<0.05.
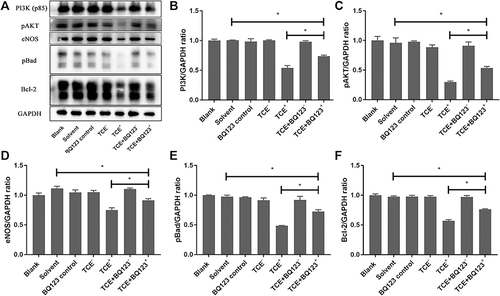
Figure 7 Glomerular endothelial cells TEM detection (×30,000). Red arrow: the fused foot processes; yellow arrow: the vacuolate degeneration of massive mitochondria; green arrow: the dilation of Golgi’s apparatus; black arrow: the slightly thickened glomerular basement membrane. Glomerular endothelial cells in solvent control group showed normal cell structure; foot processes of the podocytes appeared fused, vacuolate degeneration of massive mitochondria and dilation of Golgi’s apparatus were also observed in TCE sensitized positive mouse. Glomerular basement membrane slightly thickened, occasional vacuolate degeneration of mitochondria were seen in TCE+BQ123 sensitized positive mouse.
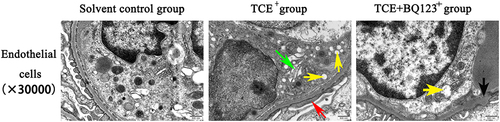
Figure 8 Glomerular apoptosis detection (×400). (A) Blank control group. (B) Solvent control group. (C) TCE+BQ123 control group. (D) TCE sensitized negative group. (E) TCE sensitized positive group. (F) TCE+BQ123 sensitized negative group. (G) TCE+BQ123 sensitized positive group. Red arrow: apoptotic cells.
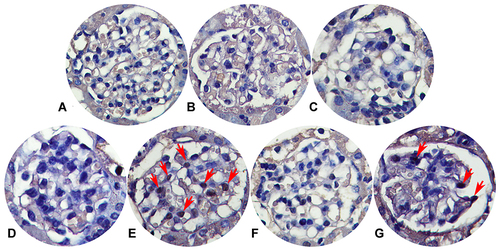
Figure 9 Glomerular apoptosis rate. The cell apoptosis rate in blank control group, solvent control group, BQ123 control group, TCE sensitized negative group and TCE+BQ123 sensitized negative group were about 3%. In TCE sensitized positive group, the cell apoptosis rate was (16.96±7.17)%. The cell apoptosis rate in TCE+BQ123 sensitized positive group was (8.85±2.53)%. a: Compared to solvent control group, P<0.05. b: compared to TCE+BQ123 sensitized positive group, P<0.05.
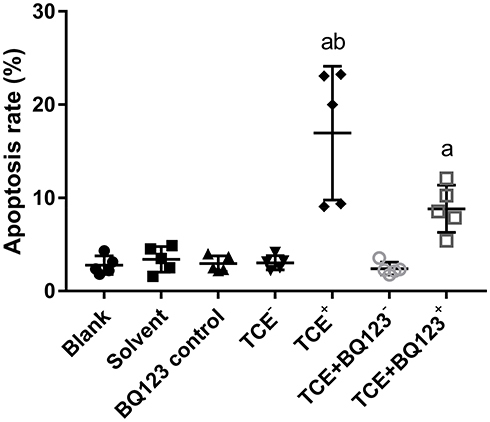
Figure 10 Protein levels of podocin and nephrin. (A) showed the Western blot results of renal podocin and nephrin. (B and C) showed the optical density values of podocin and nephrin, respectively. Compared to solvent control group, podocin and nephrin were significantly decreased in TCE sensitized positive mice (P<0.05). Podocin and nephrin increased in TCE+BQ123 sensitized positive mice compared to TCE sensitized positive mice (P<0.05). *P<0.05.
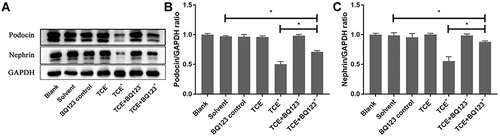
Figure 11 Glomerular podocytes TEM detection (×30,000). Yellow arrow: the vacuolate degeneration of massive mitochondria; blue arrow: podocytes with slightly swelling. Solvent control group mice showed the normal structure of podocytes. In TCE sensitized positive mice, podocytes had light swelling with mitochondria vacuolate degeneration. Mitochondrial injury reduced in TCE+BQ123 sensitized positive mice.
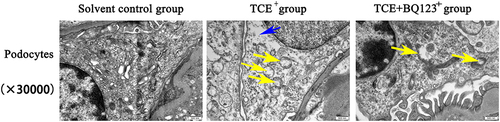
Figure 12 Protein levels of ETAR, Ang-1, Ang-2, Tie-2 and pTie-2. (A) showed the Western blot results of renal ETAR, Ang-1, Ang-2, Tie-2 and pTie-2. (B–F) showed the optical density values of ETAR, Ang-1, Ang-2, Tie-2 and pTie-2 respectively. Compared to solvent control group, ETAR and Ang-2 significantly increased while Ang-1 decreased in TCE sensitized positive group. The ETAR inhibitor BQ123 downregulated ETAR and Ang-2 expression levels and upregulated Ang-1 and pTie-2 expression levels significantly. *P<0.05.
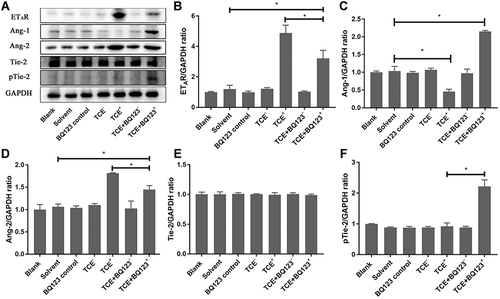
Figure 13 Protein levels of ETBR, Ang-1, Ang-2, Tie-2 and pTie-2. (A) showed the Western blot results of renal ETBR, Ang-1, Ang-2, Tie-2 and pTie-2. (B–F) showed the optical density values of ETBR, Ang-1, Ang-2, Tie-2 and pTie-2 respectively. ETBR and Ang-2 increased in TCE sensitized positive group, Ang-1 decreased in TCE sensitized positive group. ETBR was inhibited by BQ788, but Ang-2 was not inhibited by BQ788, Ang-1 and pTie-2 were not promoted by BQ788. *P<0.05.
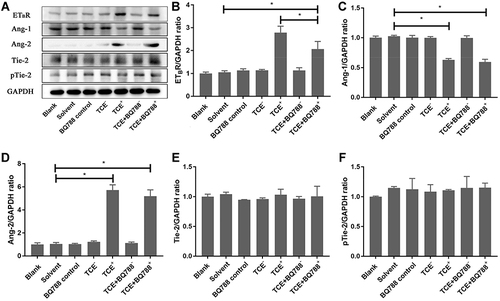
Figure 14 The location of ET-1 (×400). ET-1 was mainly expressed on endothelial cells. Yellow arrow: endothelial cells.
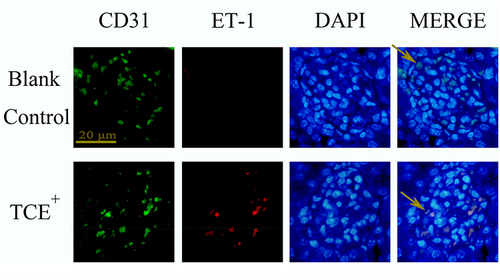
Figure 15 The location of ETAR (×400). ETAR was mainly expressed on podocytes. Red arrow: podocytes.
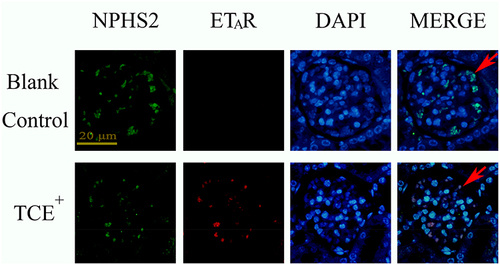
Figure 16 The location of Ang-1 (×400). Ang-1 was mainly expressed on podocytes. Red arrow: podocytes.
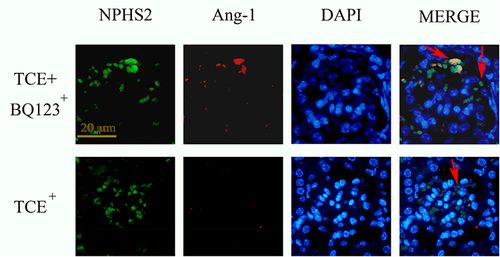
Figure 17 The location of Ang-2 (×400). Ang-2 was mainly expressed on endothelial cells. Yellow arrow: endothelial cells.
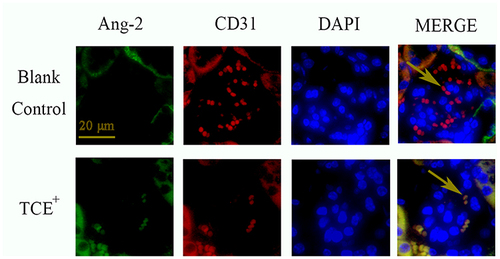
Figure 18 The location of Tie-2 (×400). Tie-2 was mainly expressed on endothelial cells. Yellow arrow: endothelial cells.
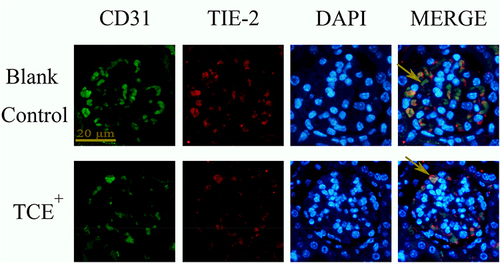
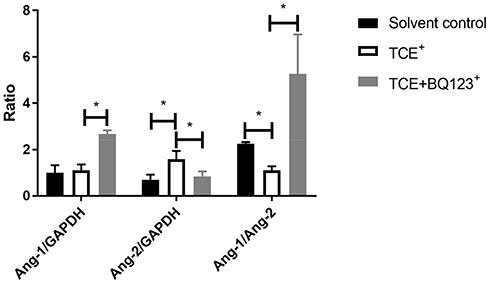
Figure 19 The gene levels of Ang-1/Ang-2. Compared to solvent control group mice, the gene level of Ang-2 was significantly increased and Ang-1 was significantly decreased in TCE sensitized positive mice, the ratio of Ang-1/Ang-2 was significantly decreased in TCE sensitized positive group, but significantly increased in TCE+BQ123 sensitized positive group mice. *P<0.05.