Figures & data
Table 1 Primers Used in qPCR
Table 2 Comparison of Clinic Data Between Patients with Keloids and Controls
Table 3 To Compare the Expression of Adiponectin, TGF-β1, CTGF, IL-6 and TNF-α in Peripheral Blood Between Patients with Keloids and Controls
Figure 1 The serum concentrations of adiponectin (A), TGF-β1 (B), CTGF (C), IL-6 (D) and TNF-α (E) in normal controls and tissues from keloid were detected by ELISA. Data represent three independent experiments. **P<0.01 compared with the control group.
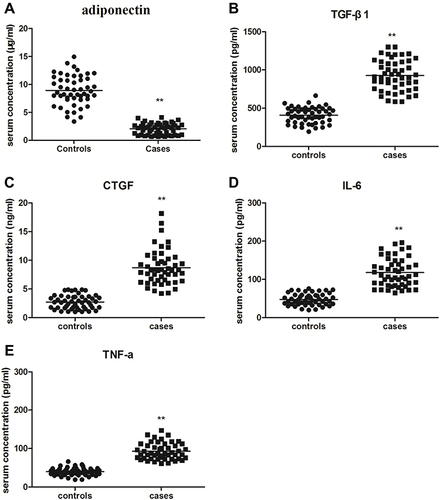
Figure 2 The mRNAs expression of adiponectin (A), TGF-β1 (B), CTGF (C), IL-6 (D) and TNF-α (E) in normal controls and tissues from keloid was detected by qPCR. Data represent three independent experiments.*P<0.05 versus the control group.
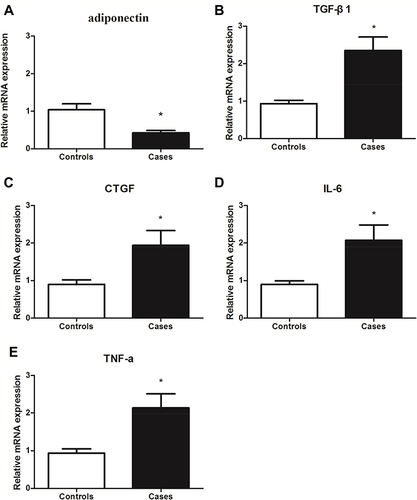
Figure 3 Correlation analysis between serum concentration of adiponectin with VSS scores (A) and ages (B) in keloid patients were measured by Pearson’s correlation. And the serum expression levels of adiponectin between different genders in patients with keloid were examined by t test (C).
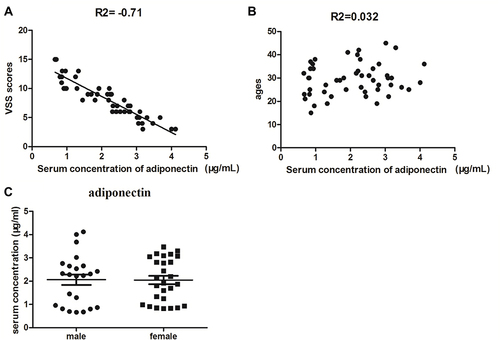
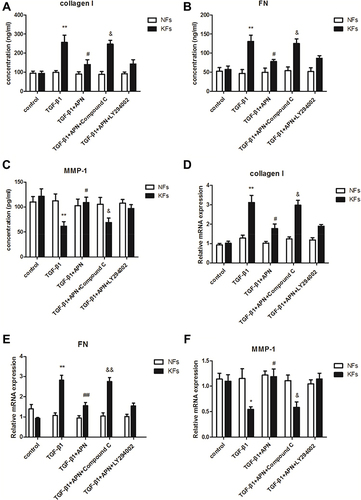
Figure 4 Adiponectin attenuated TGF-β1 mediated expression of collagen I and FN, and upregulates TGF-β1 suppressed MMP-1 expression in KFs by AMPK signaling pathway. KFs and NFs were preincubated with Compound C (10 µM, an AMPK inhibitor), or LY294002 (10 µM, a PI3K inhibitor) or without inhibitors for 24 h. After stimulation with or without adiponectin (APN, 5 µg/mL) in the presence of TGF-β1 (10 ng/mL) for 24 h, the supernatant concentration and mRNA levels of type I collagen (A and D), FN (B and E), and MMP-1 (C and F) in KFs and NFs were examined by ELISA and qPCR, respectively. Data represent at least three independent experiments. *P<0.05 versus the control group, **P<0.01 versus the control group; #P<0.05 versus the TGF-β1 group, ##P<0.01 versus the TGF-β1 group; &P<0.05 versus the TGF-β1+adiponectin group, &&P<0.01 versus the TGF-β1+adiponectin group. The results are shown as means±SE.