Figures & data
Table 1 Baseline Characteristics of Study Subjects; Study of Health in Pomerania (SHIP-Trend-0; 2008–2012)
Table 2 Results from Linear Regression Models Analyzing the Association Between Periodontitis Variables and Sphingosine-1-Phosphate Serum Levels (Continuously Modelled) in All Subjects (Aged 20–83 Years)
Figure 1 Model predicted mean (with 95% confidence bands) of sphingosine-1-phosphate serum concentrations for varying levels of (A) mean probing depth and (B) mean clinical attachment loss.
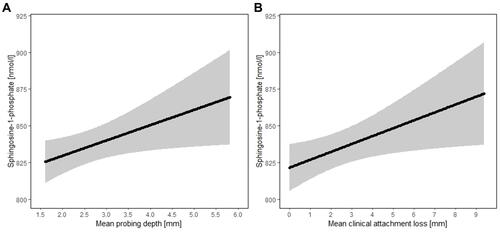
Table 3 Results from Linear Regression Models Analyzing the Association Between Periodontitis Variables and Sphingosine-1-Phosphate Serum Levels (Continuously Modelled) in Subjects Aged 20–83 Years with at Least 12 Measurement Sites for Assessments of Probing Depth or Clinical Attachment Loss
Figure 2 Model predicted mean (with 95% confidence bands) of sphingosine-1-phosphate serum concentrations for varying levels of high-sensitivity C-reactive protein (logarithmised). Estimates for effects of logarithmised CRP levels on S1P were B=24.5 (standard error 6.7, p<0.001) for the first spline and B=−15.4 (standard error 7.9, p=0.053) for the second spline according to the fully adjusted linear regression model.
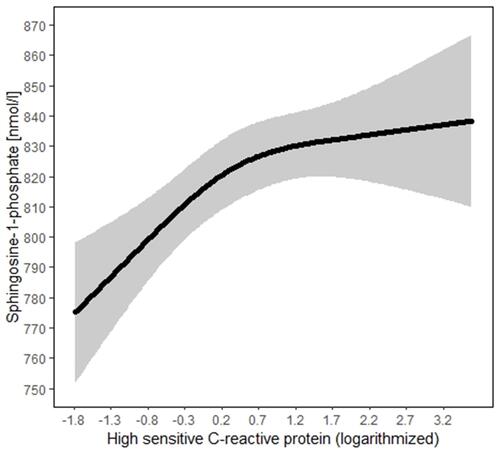
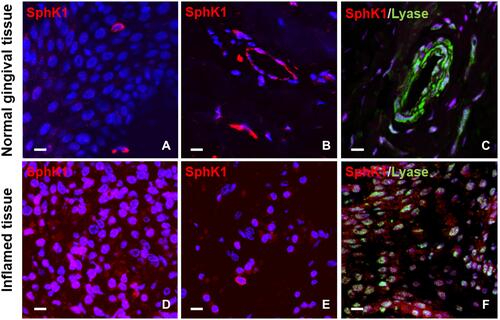
Figure 3 Representative immunofluorescence staining of human gingival tissue (A–F). (A–C) represent paraffin-embedded sections of normal gingival tissue, whereas (D–F) show paraffin-embedded sections of inflamed gingival tissue. Both DAPI staining of nuclei (blue) and staining of the sphingosine-1-phosphate (S1P)-generating enzyme sphingosine kinase 1 (SphK1; red) were performed for all sections (A–F). Staining of the S1P-degrading enzyme sphingosine-1-phosphate lyase (Lyase; green) was conducted in section C+F. Fluorescence micrographs were taken using a laser scanning microscope (Zeiss LSM780) and a 63x/1.4 objective (bar = 10 µm).