Figures & data
Figure 1 (A) Characteristics of energy metabolism for ALF patients. (B) The expression levels of L-Lactate, L-Malate, Isocitrate, Succinate, 3-phosphoglycerate, ADP, α-Ketoglutarate, ATP, Citrate, Oxaloacetate, NAD, NADPH, Phosphoenolpyruvate, and UDPglucose were significantly different between ALF patients and normal volunteers. (C) Based on the Pearson correlation analysis method, the correlation coefficient between different metabolites was calculated. The correlation between the different metabolites was displayed in the form of a correlation coefficient matrix heat map, and the expression of each metabolite was replaced by the ratio of the relative expression of the ALF group to the relative expression of the normal group. This matrix chart shows the correlation between significantly different metabolites. The Pearson correlation coefficient value R was between −1 and +1. The correlation coefficient R between metabolites was represented by color and circle, where R > 0 represents a positive correlation, and it was represented by red. R < 0 indicates a negative correlation, which was represented by blue. The larger and darker the circles, the more relevant they were. It was found that the expression for α-Ketoglutarate, Citrate, and Oxaloacetate was positively correlated with ATP. The expression for L-Malate, Isocitrate, and Succinate was negatively correlated with ATP. (D) Hypothesis diagram of M1 macrophage energy metabolism during ALF process.
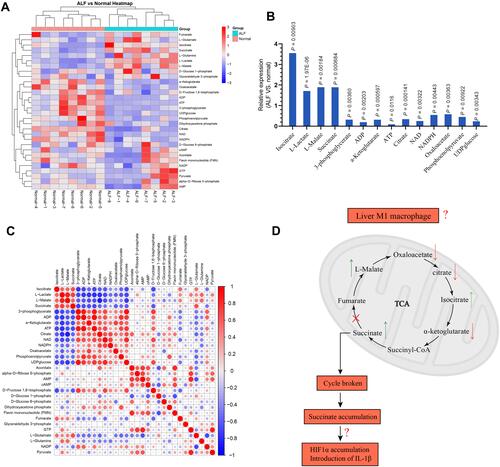
Figure 2 The effect of ACY-1215 on LPS/D-Gal induced ALF mice. (A) HE staining was used to detect histopathological changes in liver. TUNEL staining was used to detect the cell apoptosis level. The serum levels of ALT, AST, and TBIL were detected. (B) Venn diagram showing the protein quantitative sequencing. (A) ACY-1215 intervention group. M: Model group. N: Control group. M/N (up/down) represented the protein whose expression level was increased (decreased) in the model group compared with the normal group. A/M (up/down) represented the protein whose expression level was increased (decreased) in the ACY-1215 intervention group compared with the model group. The table showed different expression levels of MDH1, IDH1 and DNMT1 in different mice groups. (C) The substrate and product of MDH1 were L-Malate and Oxaloacetate. The substrate and product of IDH1 were Isocitrate and α-Ketoglutarate. (D) The levels of ATP, Oxaloacetate, MDH1, α-Ketoglutarate, Citrate, MDH1, L-Malate, Isocitrate and Succinate in liver were tested. Data are shown as mean ± SD. #P < 0.05, compared with the control group. *P < 0.05, compared with the LPS/D-Gal group.

Figure 3 The effect of ACY-1215 on Acetyl-DNMT1, DDX3X/NLRP3 pathway and cytokines in ALF mice. (A) The level of HDAC6 and DNMT1 was detected by immunofluorescence. (B) The level of NLRP3 and DDX3X was detected by immunofluorescence. Data are shown as mean ± SD. #P < 0.05, compared with control group. *P < 0.05, compared with LPS/D-Gal group.
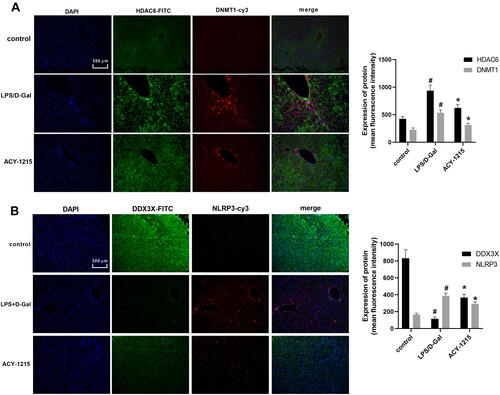
Figure 4 The effect of ACY-1215 on cytokines and marker proteins of M1 macrophages in ALF mice. (A–D) The levels of HIF1α, TNF-α, IL-6, and IL-1β were tested by ELISA kits. (E) The levels of iNOS and CD68 were detected by immunofluorescence. Data are shown as mean ± SD. #P < 0.05, compared with the control group. *P < 0.05, compared with the LPS/D-Gal group.
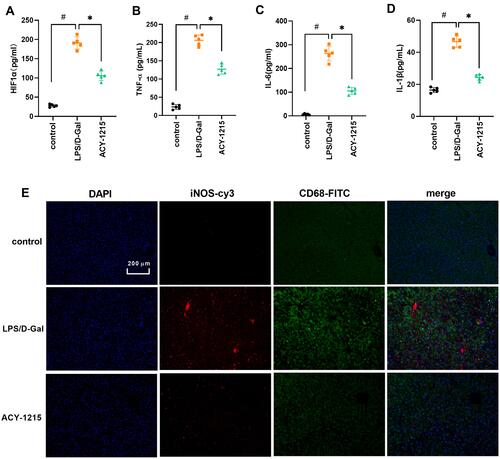
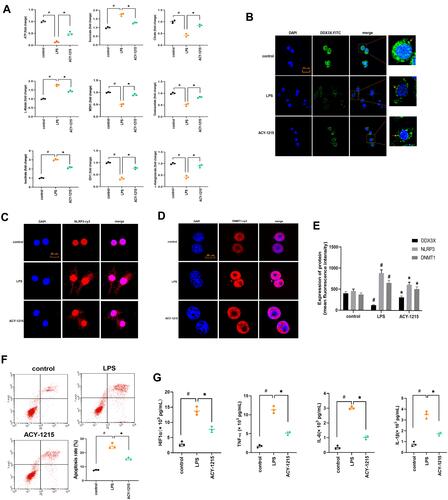
Figure 5 The effect of ACY-1215 on energy metabolite in LPS induced RAW264.7 cells. (A) The levels of ATP, Oxaloacetate, MDH1, α-Ketoglutarate, Citrate, MDH1, L-Malate, Isocitrate, and Succinate in RAW264.7 cells was tested. (B–D) The levels of DDX3X, NLRP3, and DNMT1 were detected by immunofluorescence. (E) A histogram was used to show the protein level of DDX3X, NLRP3 and DNMT1. (F) Cell apoptosis was detected by flow cytometry. (G) The levels of HIF1α, TNF-α, IL-6, and IL-1β in cell were tested by ELISA kits. Data are shown as mean ± SD. #P < 0.05, compared with the control group. *P < 0.05, compared with the LPS group.