Figures & data
Figure 1 Effects of punicalagin on cell viability in RA FLSs. Cell viability was tested by MTT assays in RA FLSs incubated with punicalagin (at the concentration 12.5, 25, and 50μM) for 48 h. Data are means of three separated experiments±SEM. *P < 0.05, vs control.
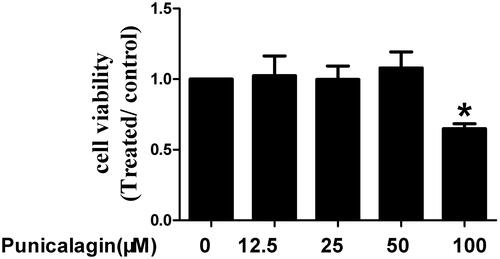
Figure 2 Punicalagin decreased the mRNA expression of pro-inflammatory cytokines in RA FLSs. RA FLS were stimulated with TNF-α (10ng/mL) for 12 h in the presence or absence of punicalagin (at the concentration 12.5, 25, and 50μM). Quantitative real-time PCR was used to measure the levels of mRNA expression. A–D, the expression of mRNA levels of IL-1β, IL-6, IL-8 and IL-17A, respectively. Data were normalized to β-Actin. Data represent the mean±SEM of 3 independent experiments. *P < 0.05 vs control, #P < 0.05 vs TNF-α.
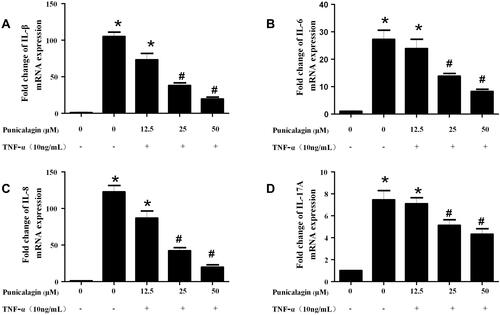
Figure 3 Punicalagin decreased the supernatant concentration of pro-inflammatory cytokines of RA FLS. RA FLS were stimulated with TNF-α (10ng/mL) for 24 h in the presence or absence of punicalagin (at the different concentration 12.5, 25, and 50μM). (A-D) The levels of pro-inflammatory cytokines (IL-1β, IL-6, IL-8 and IL-17A) in supernatants of cell culturing medium were tested by ELISA assays. The data represent the mean ± SEM of 3 independent experiments. *P < 0.05 vs control, #P < 0.05 vs TNF-α.
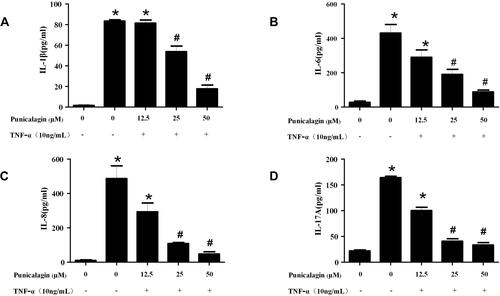
Figure 4 Punicalagin inhibited the cell proliferation of RA FLSs. (A) Cell proliferation was tested by EdU incorporation assays. Representative images show the proliferation of RA FLSs (A) labeled with EdU (red) (original magnification, ×200). (B) The bar represents the relative proliferation rate of RA FLSs. Graphs in A indicated the mean ± SEM of 3 independent experiments involving 6 different RA patients. *P < 0.05 vs control.
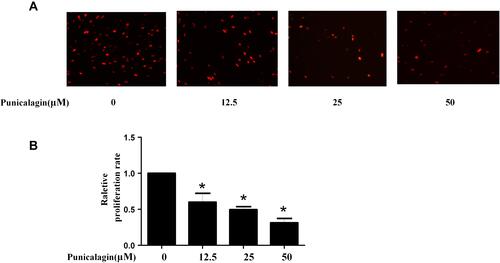
Figure 5 Punicalagin suppressed in vitro migration of RA FLSs. (A) Chemotaxic migration of RA FLSs was evaluated using a Transwell assay. Representative images (original magnification, ×100) are shown. Graphs indicate the relative migration rates. The relative migration rate represents the number of migrated cells normalized to the control. (B) The migration of RA FLSs was analyzed using a wound-healing assay. Representative images are shown (original magnification, ×50). (C) Effect of punicalagin on the actin cytoskeleton reorganization of RA FLSs. F-actin (red) and nucleus (blue) were stained with phalloidin and DAPI, respectively. Representative images are shown (original magnification, ×100). Data are shown as the mean ± SEM of 3 independent experiments involving 5 different RA patients. *P < 0.05 vs control.
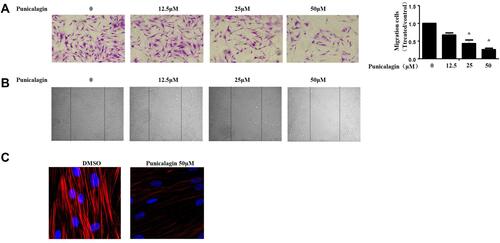
Figure 6 Effects of punicalagin on the production of MMPs in RA FLSs. (A-B) RA FLS were stimulated with TNF-α (10ng/mL) for 12 h in the presence or absence of punicalagin (at different concentration 12.5, 25, and 50μM). mRNA expression levels of MMP-1 (A) and MMP-13 (B) were measured by q-RT PCR. (C-D) The levels of MMP-1 (C), and MMP-13 (D) secreted in culture media by TNF-α stimulated (10ng/mL for 24 h) RA FLSs were measured with ELISA. Data represent the mean±SEM of 3 independent experiments. *P < 0.05 vs control, #P < 0.05 vs TNF-α.
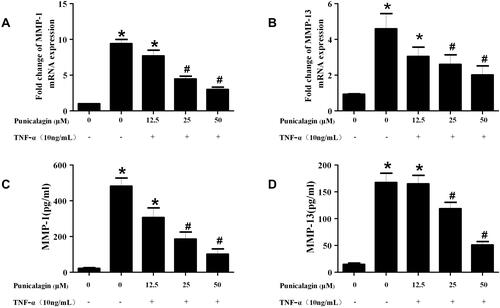
Figure 7 Punicalagin inhibits TNF-α induced NF-κB pathway activation and p65 relocation. (A) RA FLSs were pre-incubated with punicalagin for 24 h and TNF-α (10 ng/mL) for 15 min. Phosphorylation of IKK and IκBα induced by TNF-α was analyzed by Western blot analysis. The right panel shows a densitometric analysis of Western blots. The experiment was repeated at least three times. Each bar represents mean ± SD from 6 RA patients. *P < 0.05 vs control, #P < 0.05 vs TNF-α. (B) Immunofluorescence staining analysis of p65 localization. RA FLSs were pre-incubated with 50μM punicalagin for 24 h and TNF-α (10ng/mL) for 15 min, fixed, and then underwent immunofluorescence assay. The cells were stained with anti-p65 (in green) and DAPI (in blue). Representative 200× images.
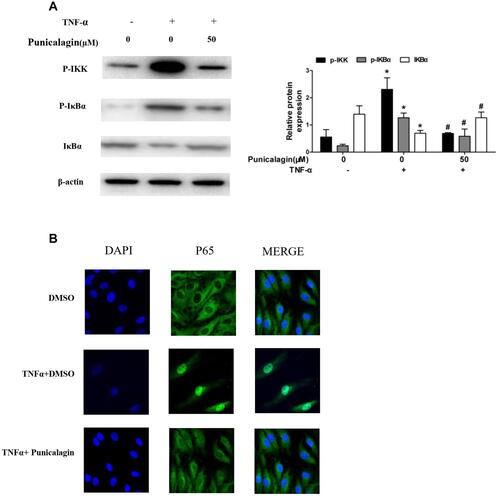
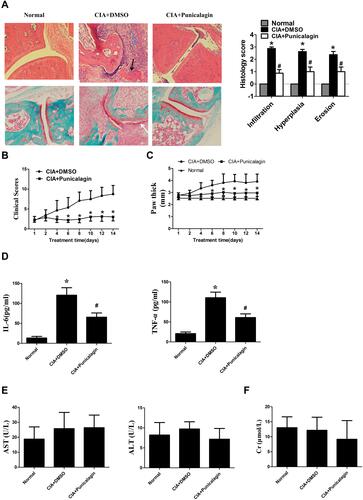
Figure 8 Punicalagin attenuated arthritis severity of CIA mice. Mice were treated with either dimethyl sulfoxide (DMSO; vehicle) or punicalagin (50 mg/kg/day) for 14 consecutive days. (A) H&E staining in the upper panel was used to observe synovial infiltration, hyperplasia, and bone destruction (×100). Safranin O/Fast green staining to proteoglycan depletion was shown in the lower panel (Original magnification×100). The blue arrow represents inflammation infiltration, the black arrow represents bone erosion, the white arrow represents the hyperplasia. *P < 0.05 vs Normal, #P < 0.05 vs CIA. (B-C) Punicalagin ameliorated clinical scores and paw swelling (change in paw thickness) of mice. Data represent the mean±SEM of 3 independent experiments. *P < 0.05 vs DMSO. (D) Punicalagin decreased the serum levels of IL-6 and TNF-α of CIA mice. The levels of the cytokines were measured by ELSIA. (E) Serum level of aspartate aminotransferase (AST) and alanine aminotransferase (ALT). (F) Serum level of creatinine (CRE), respectively. *P< 0.05 vs normal control, #P < 0.05 vs DMSO.