Figures & data
Table 1 Characteristics of Healthy and ARDS Subjects
Figure 1 Elevated HMGB1 levels and reduced Treg proportions in patients with sepsis-induced ALI. (A) Circulating HMGB1 levels in plasma were measured in patients with sepsis (n=34), septic shock (n=24), and healthy controls (n=36) using an ELISA. **p<0.01. (B) Plasma HMGB1 levels in surviving (n=36) and nonsurviving (n=22) patients with ARDS. *p<0.05 and **p<0.01. (C) Representative two-dimensional scatter diagrams of CD4+CD25+CD127low Tregs in the peripheral blood of patients with ARDS and healthy controls were analyzed using flow cytometry. (D) The percentage of CD4+CD25+CD127low Tregs in the peripheral blood of patients with ARDS (n=58) and healthy controls (n=36); means±SD, **p<0.01. (E) Correlation between the percentage of CD4+CD25+CD127low Tregs and HMGB1 levels in patients with ARDS; R2=0.535, p<0.001. The analyses in this figure were performed using permutation t-tests (A, B, and D) and Pearson’s correlation analyses (E).
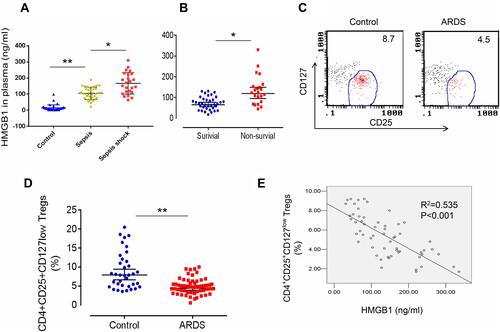
Figure 2 TLR4 deletion accelerates lung injury and the local inflammatory response induced by the HMGB1 instillation. (A) Pathological changes in lung tissues from TLR4 mice with different genotypes 48 h after an intratracheal instillation of HMGB1. (B) The morphological changes was quantified by using lung injury scoring system (C) Changes in the W/D weight ratio of the lung tissue 48 h after an intratracheal instillation of HMGB1 in mice with different TLR4 genotypes. (D) TNF-α levels were measured in BAL fluid from the control, WT, and TLR4-/- groups using an ELISA. (E) Serum TNF-α was measured by ELISA in the control, WT, and TLR4-/- groups. (F) IL-1β levels were measured in BAL fluid from the control, WT, and TLR4-/- groups using an ELISA. (G) Serum IL-1β levels were measured in the control, WT, and TLR4-/- groups using an ELISA, *p<0.05 between 3 groups by using Tukey’s test, &p<0.05 between WT and TLR4-/- group by using t-test.
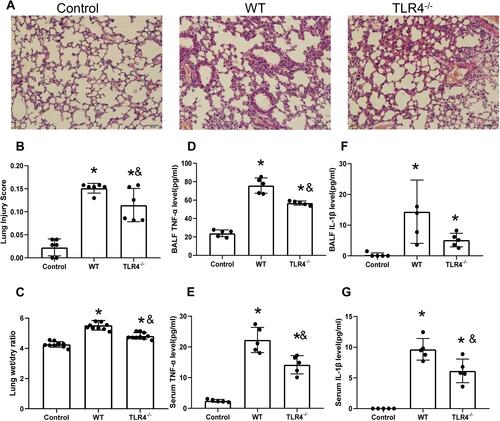
Table 2 Changes of CTLA-4 and FOXP3 Expression of CD4+CD25+Treg in Different Groups of Mice with ALI (X±s)
Figure 3 TLR4 reversed the CTLA-4 and FOXP3 downregulation caused by the HMGB1 instillation. (A) Changes in CTLA-4 and FOXP3 expression in CD4+CD25+ Tregs from different groups of mice with acute lung injury. (B) TGF-β levels in CD4+CD25+ Tregs from different groups. (C) IL-10 levels in CD4+CD25+ Tregs from different groups. (D) TGF-β content in CD4+CD25+ Tregs from mice with different genotypes stimulated with HMGB1. (E) IL-10 content in CD4+CD25+ Tregs from mice with different genotypes stimulated with HMGB1, *p<0.05 between 3 groups by using Tukey’s test, and &p<0.05 between WT and TLR4-/- group by using t-test.
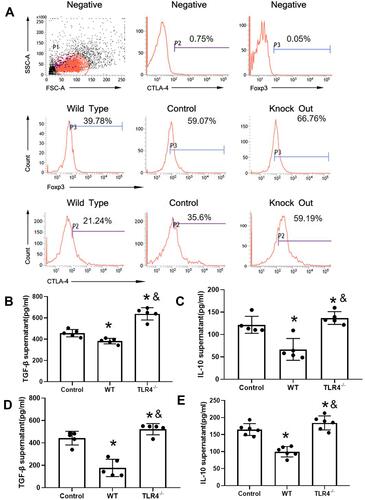
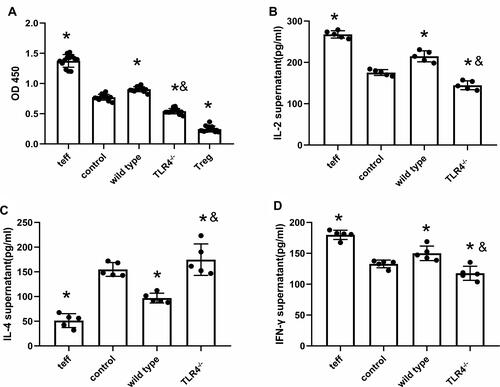
Figure 4 TLR4 deletion reverses HMGB1-induced polarization towards the Th1 phenotype. (A) The CCK-8 method was used to detect the effects of CD4+CD25+ Tregs on the proliferation of CD4+CD25− T cells from different groups. (B) Changes in IL-2 contents in cocultures of CD4+CD25+ Tregs and CD4+CD25− T cells. (C) IL-4 contents in cocultures of CD4+CD25+ Tregs and CD4+CD25− T cells. (D) IFN-γ contents in cocultures of CD4+CD25+ Tregs and CD4+CD25− T cells, *p<0.05 between 3 groups by using Tukey’s test, and &p<0.05 between WT and TLR4-/- group by using t-test.