Figures & data
Figure 1 Study protocol. Murine model of IS was established by tMCAO. Ischemia and reperfusion were confirmed by laser Doppler.
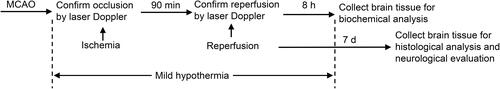
Figure 2 Cerebral IRF4 expressions after IS. RT-PCR (A) and Western-blots (B) were used to measure IRF4 mRNA and protein expressions, respectively. n = 6 in each group. Data were expressed as mean±SD. Comparisons of continuous variables between groups were made by unpaired Student’s t-test. *p < 0.05, ***p < 0.001 vs control group; ##p<0.01, ###p<0.001 vs IS group; ΔΔΔp<0.001 vs IS + TH group.
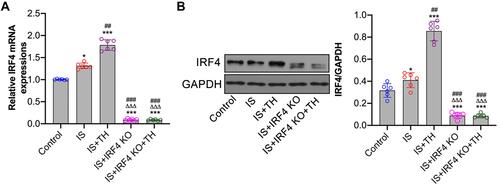
Figure 3 Measurement of cytokines. Brain penumbra tissues were collected at 8 hours after IS for the measurements of cytokines. Pro-inflammatory cytokines including IL-1β (A), IL-6 (B) and TNF-α (C) and anti-inflammatory cytokines including IL-4 (D), IL-10 (E) and TGF-β (F) were measured by enzyme-linked immunosorbent assay (ELISA) assays. n = 6 in each group. Data were expressed as mean±SD. Comparisons of continuous variables between groups were made by unpaired Student’s t-test. *p < 0.05, **p < 0.01, ***p < 0.001 vs control group; #p<0.05, ##p<0.01, ###p<0.001 vs IS group; ΔΔΔp<0.001 vs IS + TH group.
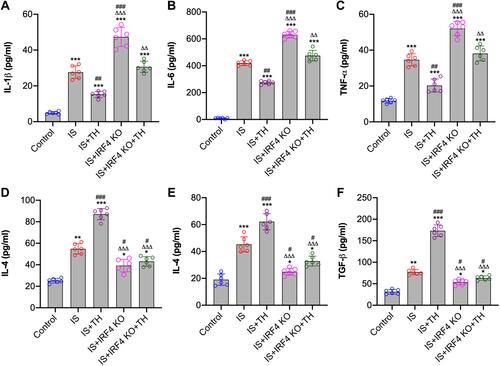
Figure 4 Determination of macrophage polarization in ischemic brain. RT-PCR were used to measure the mRNA and protein expressions of iNOS (A) and Arg-1 (B), respectively. Immunofluorescence staining (C) was used to determine the number of F4/80+/iNOS+ positive (D) and F4/80+/CD206+ positive (E) cells in penumbra tissues. n = 6 in each group for mRNA measurements; n = 4 in the IS + IRF4 KO group, n = 5 in the IS + IRF4 KO + TH group, and n = 6 in other groups for immunofluorescence staining. Data were expressed as mean±SD. Comparisons of continuous variables between groups were made by unpaired Student’s t-test. *p < 0.05, **p < 0.01, ***p < 0.001 vs control group; #p<0.05, ##p<0.01, ###p<0.001 vs IS group; ΔΔΔp<0.001 vs IS + TH group.
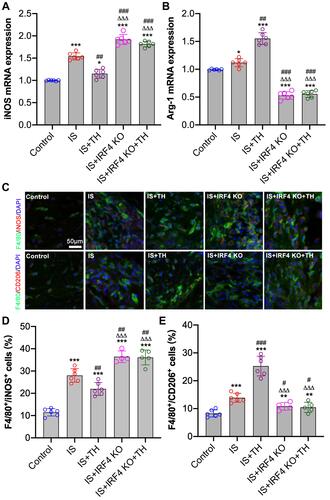
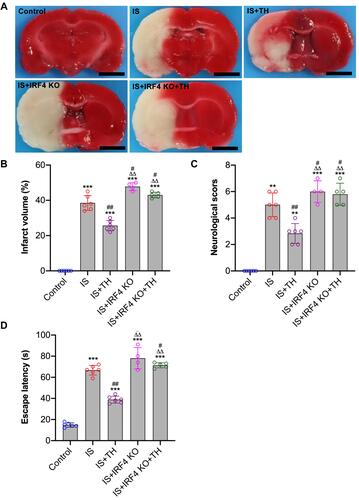
Figure 5 Neurological function assessments. Histological and neurological assessments were performed at 7 days after IS. Brain tissues were used for TTC staining (A) for the evaluation of cerebral infarct volume (B); neurological deficits scores (C) and escape latency (D) of water maze test were both determined. n = 4 in the IS + IRF4 KO group, n = 5 in the IS + IRF4 KO + TH group, and n = 6 in other groups. Data were expressed as mean±SD. Comparisons of neurological scores were made by Mann–Whitney test. Comparisons of infarct volume and EL between groups were made by unpaired Student’s t-test. **p<0.051, ***p<0.001 vs IS group; #p<0.05, ##p<0.01 vs IS group. ΔΔp<0.01 vs IS + TH group.