Figures & data
Figure 1 Experimental design and schematic diagram of the workflow of this study.
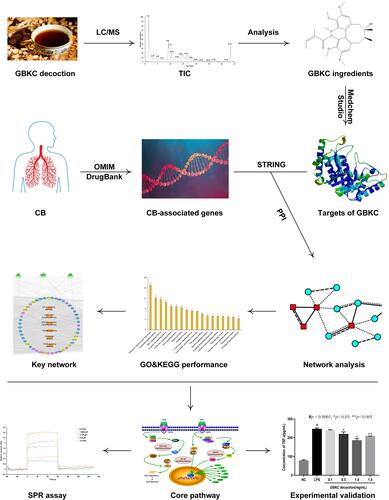
Table 1 Analysis of the Chemical Constituents of GBKC by UHPLC-LTQ-Orbitrap in Positive Ion Mode
Table 2 Analysis of the Chemical Constituents of GBKC by UHPLC-LTQ-Orbitrap in Negative Ion Mode
Figure 2 GO term performance of the major hubs. (A) GO: BP; (B) GO: CC; (C) GO: MF. The abscissa stands for GO terms, the ordinate stands for minus log 10(P).
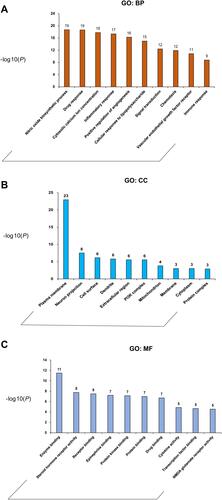
Figure 3 Main KEGG pathways composed of the major hubs. The abscissa stands for KEGG pathways, the ordinate stands for minus log 10(P).
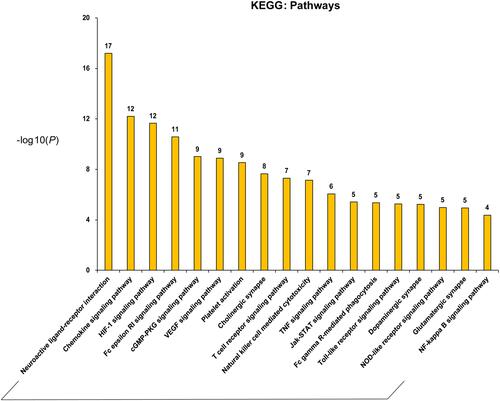
Figure 4 GBKC-major hubs-main pathway network. Green triangles represent each herbs contained in GBKC; round blue nodes represent putative targets of GBKC; round red nodes represent CB associated targets; round yellow nodes represent both GBKC targets and CB associated targets; orange rectangles represent top 18 pathways from enrichment analysis of major targets; edges represent interactions among herbs in GBKC, putative targets, CB associated targets, and main pathways.
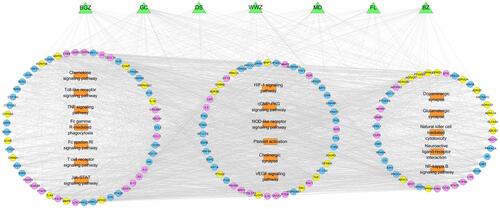
Figure 5 Illustration of TNF signaling pathway influenced by major putative targets of GBKC.
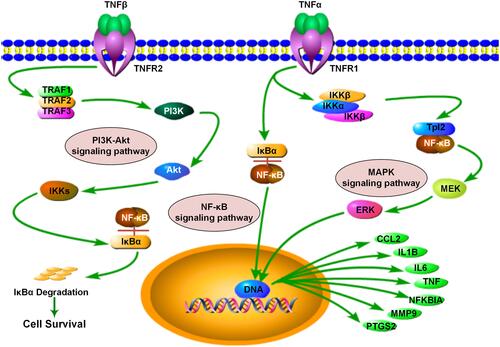
Table 3 Molecular Docking Results
Figure 6 The binding modes of Isoliquiritin and protein TNF-α. (A) Schematic (3D) representation and (B) Schematic (2D) representation of the interplay between isoliquiritin and TNF-α (PDB IDchimeric 2AZ5). The compounds were shown as stick model with purple colored and the others were active site amino acid residues.
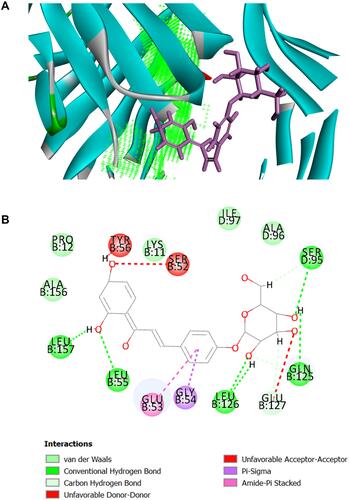
Figure 7 The surface plasmon resonance (SPR) assay of the interaction of formononetin with NFKB1, isoliquiritin with TNF-α, MMP9 proteins, liquiritin with MMP9, and bavachin, bavachinin A, liquiritin, ononin with MAPK1. (A) The SPR curves of formononetin binding to NFKB1 (left) and the representative binding curve (right). (B) The SPR curves of isoliquiritin binding to TNF-α (left) and the representative binding curve (right). (C) The SPR curves of isoliquiritin binding to MMP9 (left) and the representative binding curve (right). (D) The SPR curves of liquiritin binding to MMP9. (E) The SPR curves of bavachin binding to MAPK1. (F) The SPR curves of bavachinin A binding to MAPK1 (left) and the representative binding curve (right). (G) The SPR curves of ononin binding to MAPK1 (left) and the representative binding curve (right). (H) The SPR curves of liquiritin binding to MAPK1.
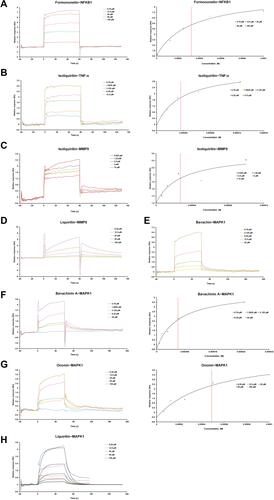
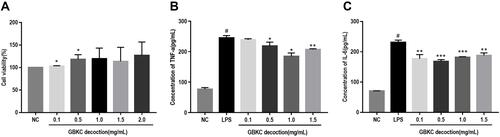
Figure 8 GBKC alleviates the secretions of IL-6 and TNF-α in LPS-induced MH-S cells. (A) Cell viability. Data are presented as the mean ± SD (n=3) *p< 0.05, compared with normal control (NC) group. (B) TNF-α. (C) IL-6. Data are presented as the mean ± SD (n=3) #p < 0.0001 compared with NC group. *p< 0.05; **p< 0.005; ***p< 0.0005, compared with the LPS group.