Figures & data
Table 1 Clinical and Laboratory Characteristics of 155 Severe/Critical COVID-19 Patients at Admission According to Disease Outcome
Table 2 Initial CT Characteristics of 147 Severe/Critical COVID-19 Patients at Admission According to Disease Outcome
Figure 1 Imaging characteristics of 516 CTs from 147 patients with severe/critical COVID-19 during the four defined stages. The detailed CT features of the survival group and the non-survival group are shown in (A–O). GGO, ground-glass opacity.
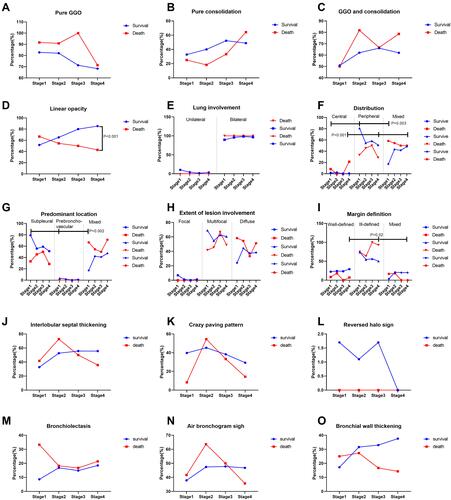
Figure 2 Imaging features of 516 CTs from 147 patients during four stages. The detailed CT features of the survival group and the non-survival group are shown in (A–L). *P<0.05; **P<0.01.
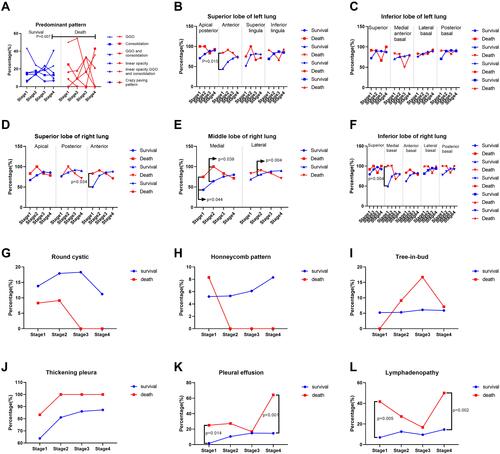
Figure 3 The scores of 516 CTs in 147 patients during four stages. Temporal changes in CT scores (A–D) and the number of lung lobes and lung segments involved during the four stages (E and F). GGO, ground-glass opacity.
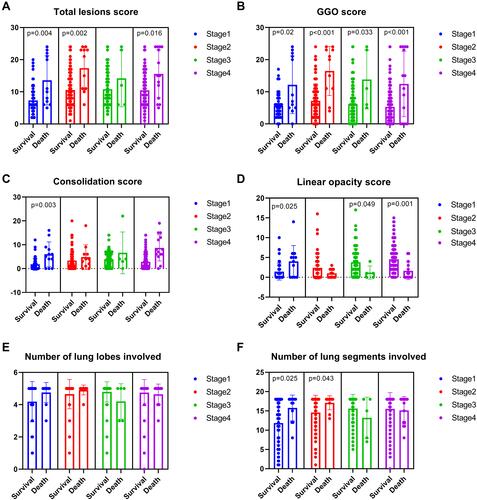
Table 3 Clinical Risk Factors Associated with Non-Survivability of Severe/Critical COVID-19 According to Univariable Logistic Regressions
Table 4 Clinical Risk Factors Associated with Non-Survivability of Severe/Critical COVID-19 According to Multivariable Logistic Regressions in Two Models
Figure 4 AUCs of the six independent risk factors. Individual ROC curves of six independent risk factors (A) and their individual predictive performance (B). ROC curves of different combination of the six independent risk factors (C) and their corresponding predictive performance (D). *P<0.05; **P<0.01.
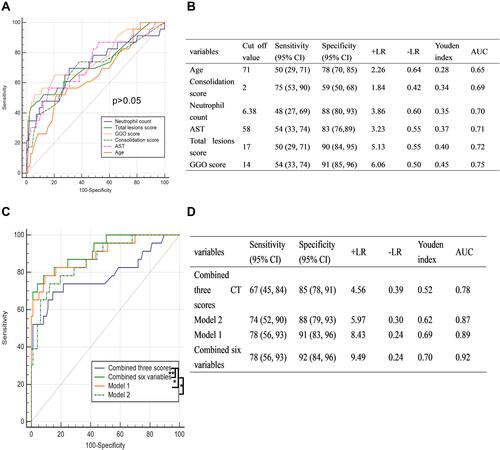
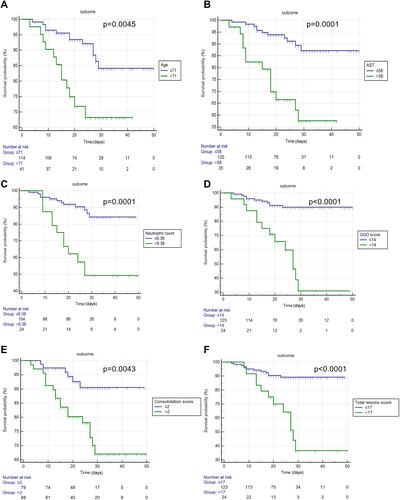
Figure 5 Kaplan–Meier curves of the six independent risk factors. Kaplan–Meier curves of patients with age ≤71 years and age >71 years (A), AST ≤58 IU/L and AST >58IU/L (B), neutrophil count ≤6.38 × 10⁹/L and neutrophil count >6.38 × 10⁹/L (C), GGO score ≤14 and GGO score >14 (D), consolidation score ≤2 and consolidation score >2 (E), and total lesions score ≤17 and total lesions score >17 (F).