Figures & data
Figure 1 Representative profile of the changes in the absorbance of mitochondria isolated from rats treated with: graded doses of lipopolysaccharide to induce inflammation in the liver (A), ibuprofen as an anti-inflammatory drugn (B), and graded doses of the n-hexane fraction of A. boonei (C).
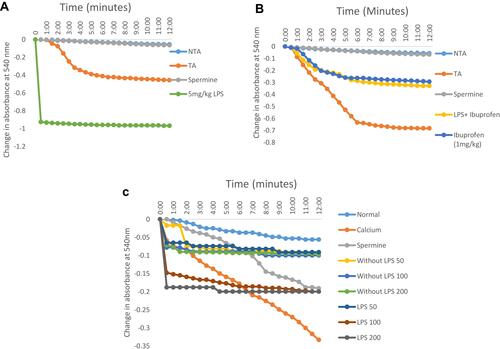
Figure 2 Influence of the n-hexane fraction of A. boonei on F0F1 ATPase activity in lipopolysaccharide-induced hepatic inflammation in rats. *P<0.05; **P<0.01; ***P<0.001 LPS control versus test groups.
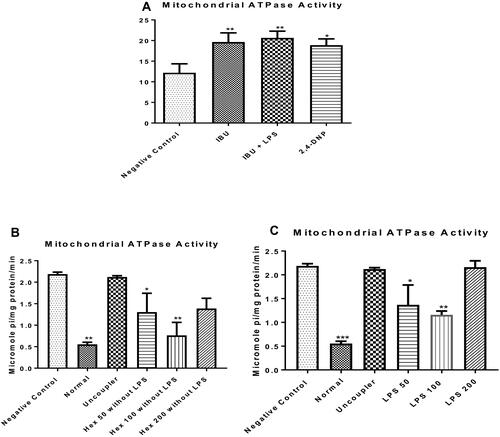
Figure 3 Mitigating effects of the n-hexane fraction of A. boonei on increase in interleukin 1 beta (A) and interleukin 6 (B) induced by lipopolysaccharide. Where ns= not significant; ****=P<0.0001 LPS control versus test groups.
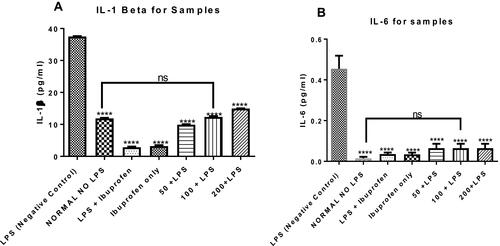
Figure 4 Effects of the administration of the n-hexane fraction of A. boonei to rats challenged with lipopolysaccharide on TNF-α (A), creatine kinase (B) and C-reactive protein (C). *P<0.05; **P<0.01; ***P<0.001; ****P<0.0001 LPS control versus test groups.
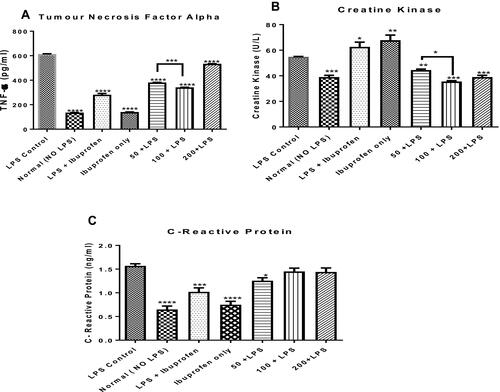
Figure 5 Mitigating effect of the n-hexane fraction of Alstonia boonei on hepatotoxic effects of lipopolysaccharide using aspartate (A) and alanine (B) aminotransferases as well as gamma glutamyl transferase (C). *P<0.05; **P<0.01; ***P<0.001; ****P<0.0001 treated groups vs lipopolysaccharide negative control.
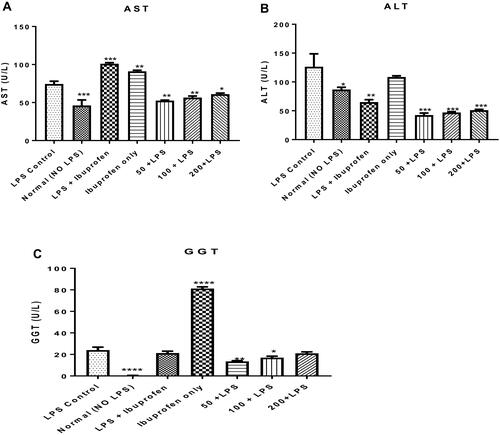
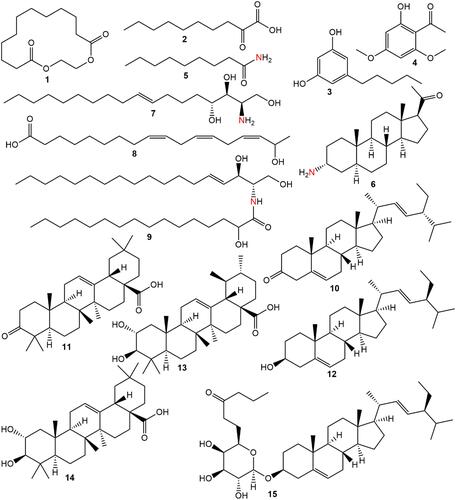
Table 1 UHPLC-MS Report of the n-Hexane Fraction of A. boonei
Figure 6 Phytochemicals identified in the n-hexane fraction of A. boonei.