Figures & data
Table 1 Demographics and Clinical Characteristics of the Patient Population
Figure 1 Age-dependent alteration in inflammatory cytokines. Inflammatory cytokines were tested in the blood samples obtained within 2 days of admission post-COVID-19 testing. Levels of IL-2 (A), IL-4 (B), IL-6 (C), IL-10 (D), TNFα (E), and IFNγ (F). Each dot represents one patient. p values were calculated by Student’s t-test and indicated on each graph.
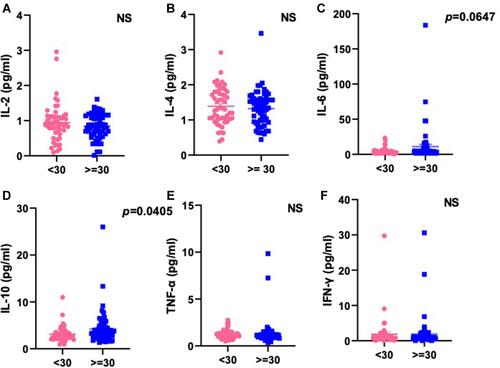
Figure 2 Age-associated alteration in peripheral blood counts in COVID-19 patients. Total red blood cells (RBC) (A) and white blood cells (B) were counted in the blood samples. Neutrophil (C), lymphocyte (D), monocyte (E), and eosinophils (F) were presented as a fraction of total WBC counts. B (G), NK (H), and NKT (I), and T (J) cells are presented as a fraction of the lymphocyte population. CD4+ (K) and CD8+ (L) cells were counted as a fraction of total T cells. The ratio of CD4+/CD8+ (M) was counted in each patient. Tregs were counted as a fraction of T cells (N). All the tests were completed within 2 days of admission. Each dot represents one patient. p values were calculated by Student’s t-test and indicated on each graph.
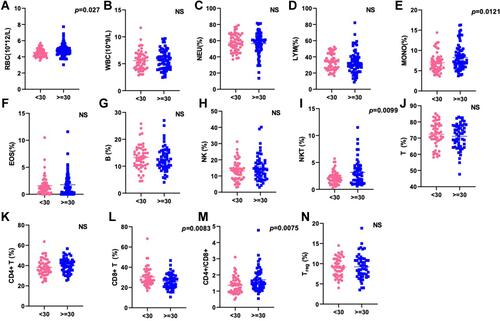
Figure 3 Humoral response and viral kinetics in patients with COVID-19. IgG and IgM onsets were measured in patients and days of onset were compared between young and old patients starting from the day of the first viral positive test. Duration of IgM (A) or IgG (B) positivity post-infection. Viral loads were measured every other day after the first test. Viral load at the first Ct values of the first qPCR test against viral gene ORF-1 (C) and N gene (E). The highest viral load (lowest Ct) during the course of the disease were measured for ORF-1 (D) and N gene (F). The overall duration of viral positivity between two groups (G). Correlation between duration of IgM (H) or IgG (I) onset with the duration of viral persistence. Adjusted R2is indicated on each graph. Each dot represents one patient. p values were calculated by Student’s t-test or linear regression analysis.
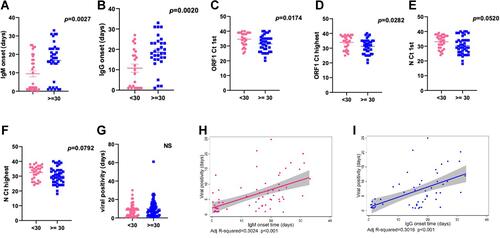
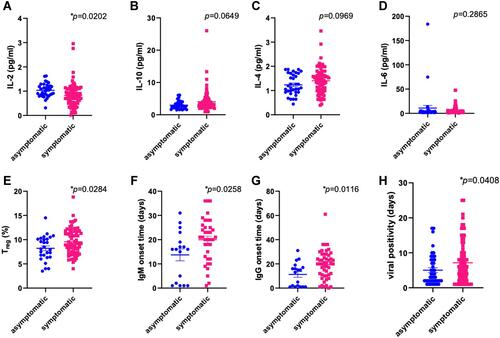
Figure 4 Impaired inflammatory response and delayed humoral response leads to symptomatic disease in COVID-19. Patients were divided into two groups based on the fact if they developed disease symptoms or not before they turned viral negative on a PCR assay. The level of cytokines including IL-2 (A), IL-10 (B), IL-4 (C), and IL-6 (D) from the blood drawn for the first time. P values are indicated on each graph. The percentage of T regulatory T cells in the blood (E). Time to SARS-CoV-2 specific IgM (F) and IgG (G) onset. Duration of viral persistence after the first detection (H).