
Figures & data
Table 1 Relationship Between zc3h12d Expression and Clinicopathology in the LUAD Cohort
Figure 1 zc3h12d expression in LUAD. (A) zc3h12d expression level in different cancer types in the TCGA database. (B) zc3h12d expression in subtype of human LUAD. *Indicates p < 0.05, **Indicates p < 0.01, ***Indicates p < 0.001.
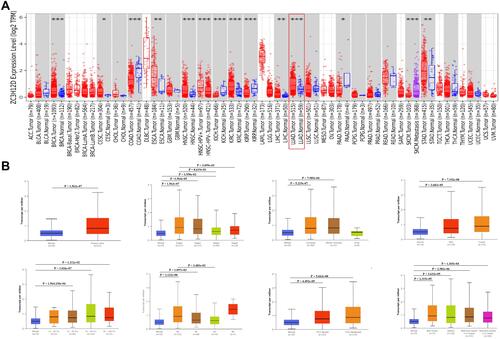
Figure 2 IHC and prognosis of zc3h12d in LUAD. (A) zc3h12d protein expression in LUAD tissues (200×magnification). (B) K-M survival curves for OS and DFS in LUAD patients by GEPIA. (C) K-M survival curves for OS in LUAD patients by Kaplan–Meier Plotter database. (D) K-M survival curves of OS in LUAD patients based on tumor specimens (n = 87).
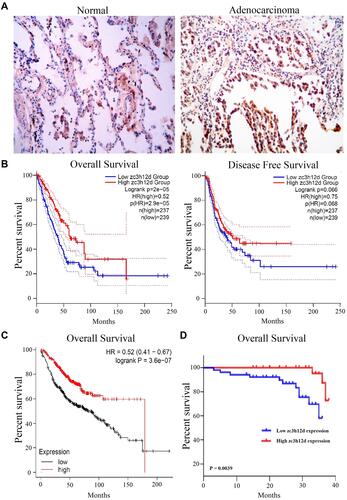
Table 2 Univariate and Multivariate Analyses of Factors Associated with OS in LUADs Using Cox Regression
Figure 3 Methylation of zc3h12d in patients with LUAD. (A) The heat map of DNA methylation clustered expression of zc3h12d in LUAD. Red to blue scale indicates high to low expression. Various colorful side boxes were used to characterize the ethnicity, race, age, event, and relation to UCSC_CpG_island and UCSC_refGene_Group. (B) Promoter methylation of the zc3h12d gene is significantly downregulated in LUAD.
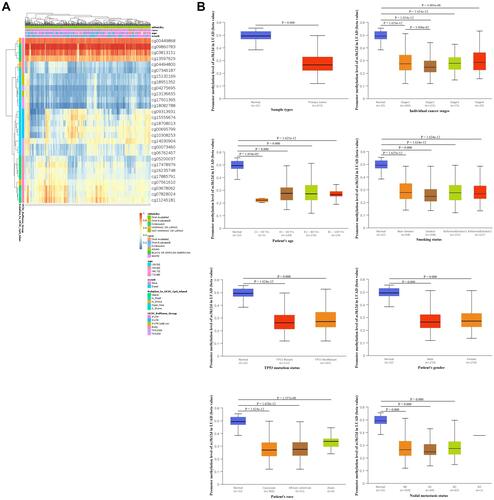
Figure 4 Gene alteration of zc3h12d in LUAD. (A) The alteration frequency of zc3h12d in different cancer types in the TCGA database. (B) K-M survival curves between zc3h12d altered group and unaltered group by cBioportal.
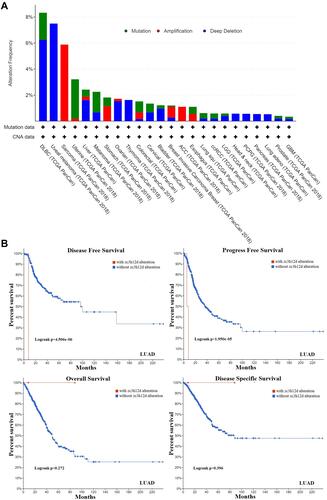
Figure 5 Functional enrichment of zc3h12d. The gene ontology (GO) and Kyoto Encyclopedia of Genes and Genomes (KEGG) enriched terms colored according to P-values.
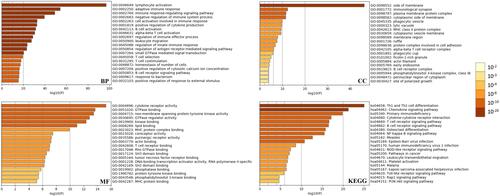
Figure 6 Correlation of zc3h12d with immune infiltration level in LUAD. (A) The correlations between zc3h12d expression and infiltrating levels of immune cells, including B cell (p = 1.30e-13), CD8 + T cell (p = 1.18e-04), CD4 + T cell (p = 2.59e-20), neutrophil (p = 4.52e-15), macrophage (p = 1.57e-01), dendritic cells (p = 1.13e-09), tregs (p = 9.14e-03), monocyte (p = 5.01e-06), and NK cell (p = 7.54e-01) relative to zc3h12d expression. (B) Relations between the expression of zc3h12d and B cells in LUAD (p = 0.0009).
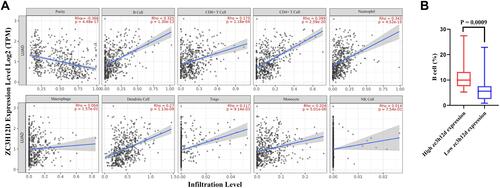
Table 3 Correlation Analysis Between zc3h12d and Immune Cell Type Markers in TIMER Database