Figures & data
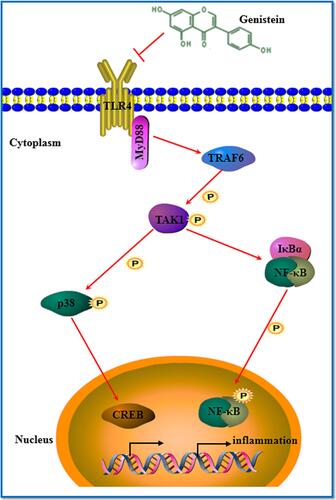
Figure 1 Genistein reduces isoflurane-induced cell apoptosis in hippocampal regions of rat. The effect of genistein (20, 40 or 80 mg/kg) on isoflurane-induced neuronal apoptosis by flow cytometer, and the statistical comparison of the proportion of apoptotic cells was showed in a column chart at last. n=6. Data was expressed as (mean ± SD), and One-way ANOVA was used to calculate the P value. ### was P<0.001 vs Control group; * was P<0.05 and *** was P<0.001 vs ISO group.
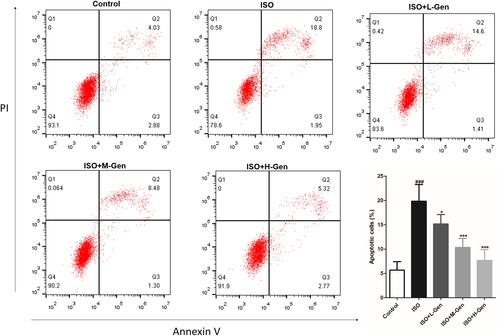
Figure 2 Genistein decreases inflammatory cytokines expression. The effect of genistein (20, 40 or 80 mg/kg) on isoflurane-induced inflammatory cytokine expression in hippocampal regions of rat, and were detected by qPCR (A–D) and elisa assay (E–H). n=6. Data was expressed as (mean ± SD), and One-way ANOVA was used to calculate the P value. ### was P<0.001 vs Control group; ns was P>0.05, * was P<0.05, ** was P<0.01 and *** was P<0.001 vs ISO group.
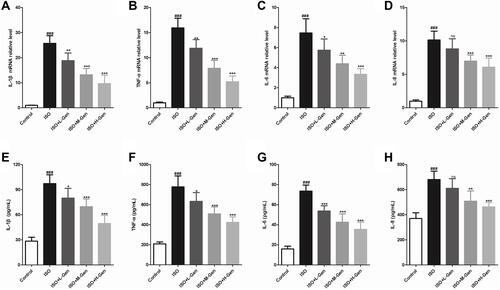
Figure 3 Genistein switches in the pro-inflammatory/anti-inflammatory microglia activation. We harvested hippocampal regions of rat after inducing by isoflurane and treating with genistein, and then we firstly detected the surface markers expression of M1 (A and B) and M2 (C and D) microglia by qPCR, and then analyzed the ratio of M1 (Iba-1+CD16+) and M2 (Iba-1+Arg1+) macrophages by flow cytometry (E), and statistical comparison of the ratio of M1 (F) and M2 (G) microglia in different groups. n=6. Data was expressed as (mean ± SD), and One-way ANOVA was used to calculate the P value. ns was P>0.05, ### was P<0.001 vs Control group; ns was P>0.05, * was P<0.05, ** was P<0.01 and *** was P<0.001 vs ISO group.
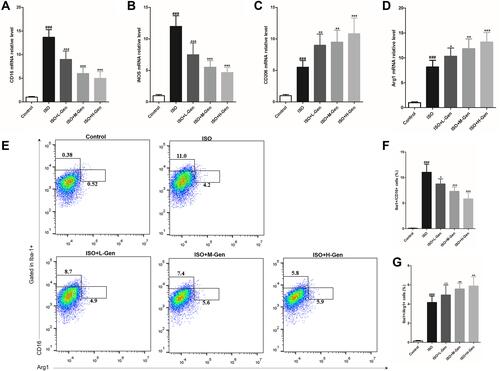
Figure 4 Genistein reduces isoflurane-activated TLR4 pathway. We harvested hippocampal regions of rat after inducing by isoflurane and treating with genistein, and then we firstly analyzed TLR4 protein expression using immunochemistry (A). Next, we detected the key protein (such as TLR4, MyD88, TRAF6 and TAK1) expression in TLR4 pathway using Western blot (B), and the band intensity was statistically compared in column chart (C–G). n=6. Data was expressed as (mean ± SD), and One-way ANOVA was used to calculate the P value. & was P>0.05 and ### was P<0.001 vs Control group; ns was P>0.05, * was P<0.05, ** was P<0.01 and *** was P<0.001 vs ISO group.
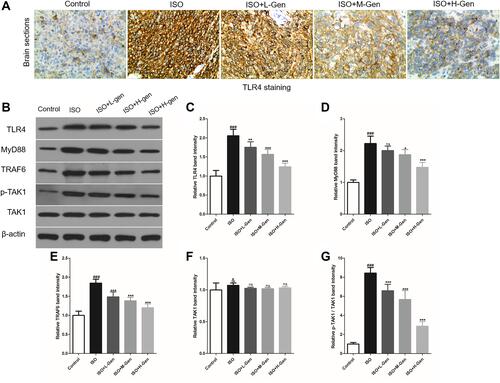
Figure 5 Genistein reduces isoflurane-activated p38 MAPK pathway. We harvested hippocampal regions of rat after inducing by isoflurane and treating with genistein, and then we analyzed the key protein (p38 and ERK) expression in p38 MAPK pathway using Western blot (A), and the band intensity was statistically compared in column chart (C–E). n=6. Data was expressed as (mean ± SD), and One-way ANOVA was used to calculate the P value. & was P>0.05 and ### was P<0.001 vs Control group; ns was P>0.05; * was P<0.05 and *** was P<0.001 vs ISO group.
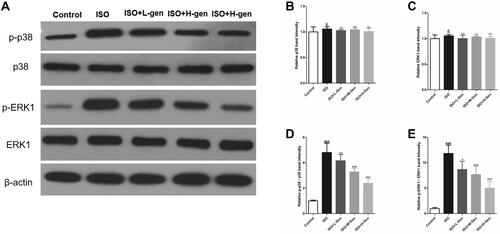
Figure 6 Genistein reduces isoflurane-activated NF-κB pathway. We harvested hippocampal regions of rat after inducing by isoflurane and treating with genistein, and then we analyzed the key protein (IκBα and NF-κB) expression in NF-κB pathway using Western blot (A), and the band intensity was statistically compared in column chart (B–E). n=6. Data was expressed as (mean ± SD), and One-way ANOVA was used to calculate the P value. & was P>0.05 and ### was P<0.001 vs Control group; ns was P>0.05; ** was P<0.01 and *** was P<0.001 vs ISO group.
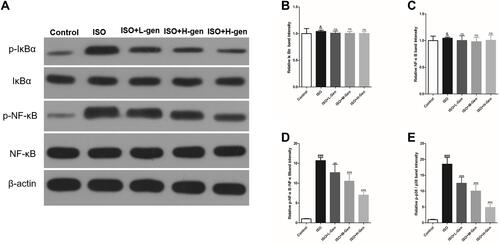
Figure 7 Genistein suppresses M1 microglia polarization and promoted microglia polarization to the M2 phenotype in isoflurane-stimulated BV2 cells. BV2 cells was firstly stimulated with or without 50 μmol/L genistein for 24 hours and then stimulated with 0.4% isoflurane for 6 hours. Next, we harvested BV2 cells, and detected proinflammatory cytokines (TNF-α, IL-1β, IL-6 and IL-8) (A–D), the surface markers expression of M1 (E and F) and M2 (G and H). Data was expressed as (mean ± SD), and One-way ANOVA was used to calculate the P value. ns was P>0.05 and ### was P<0.001 vs Control group; *** was P<0.001 vs ISO group.
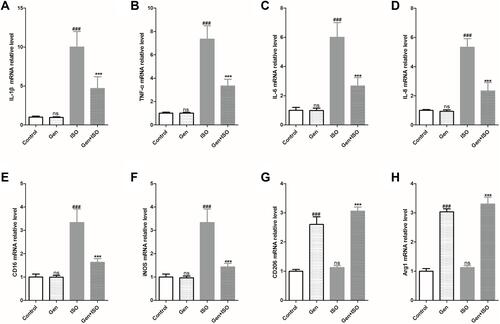
Figure 8 Genistein reduces isoflurane-induced M1 microglia polarization and promotes isoflurane-induced M1 microglia polarization in BV2 cells. BV2 cells was firstly stimulated with or without 50 μmol/L genistein for 24 hours and then stimulated with 0.4% isoflurane for 6 hours. Next, we harvested BV2 cells, and detected the surface markers expression of M1 (CD16 and iNOS) and M2 (CD206 and Arg1) using Western blot (A–E) and cellular immunofluorescence (F and G). Data was expressed as (mean ± SD), and One-way ANOVA was used to calculate the P value. ns was P>0.05 and ### was P<0.001 vs Control group; *** was P<0.001 vs ISO group.
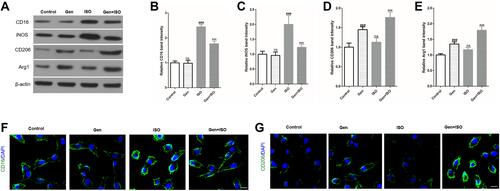
Figure 9 Genistein cannot switch microglial polarization in TLR4 knockout BV2 cells. BV2 cells was firstly stimulated with or without 50 μmol/L genistein for 24 hours and then stimulated with 0.4% isoflurane for 6 hours. Next, we harvested BV2 cells, and detected the expression of TLR4 protein using Western blot (A). We firstly established TLR4 knockout (TLR4) BV2 cells and verified by immunoblotting (B) and immunofluorescence (C), and this TLR4 KO BV2 cells was analyzed the surface markers expression of M1 (CD16 and iNOS) and M2 (CD206 and Arg1) using Western blot (D–H) and determined cellular immunofluorescence (I and J) after stimulating with 2.4% isoflurane for 6 hours followed by stimulating with or without 50 μmol/L genistein for 24 hours. Data was expressed as (mean ± SD), and P value was calculated by One-way ANOVA in (A) and by student’s t-test in (D–H). ### was P<0.001 vs control group, ns was P>0.05 and *** was P<0.001 vs ISO group.
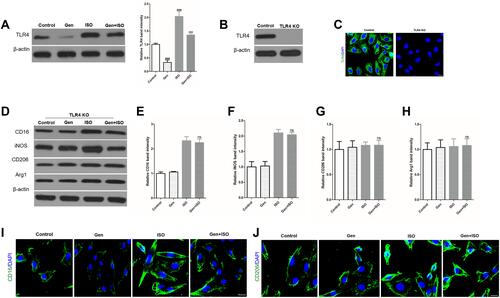
Figure 10 Schematic diagram of genistein attenuates isoflurane-induced neurotoxicity by inhibiting TLR4-mediated microglia-inflammatory.