Figures & data
Figure 1 Dox treatment reduces Stim1 expression and SOCE in cardiomyocytes. (A) Western blotting analysis of Stim1 expression in myocardium of mice after vehicle or Dox treatment for 14 days. **P<0.01 vs vehicle, n=12/group. (B) Cardiomyocytes were treated with Dox (1 μmol/L) for different times as indicated. The expression of STIM1 was determined by Western blotting. *P<0.05, **P<0.01 vs vehicle, n=6. (C) Immunoblotting (IB) for Orai1 or Trpc1 after immunoprecipitation (IP) with anti-Stim1 antibody in myocardium from vehicle- or Dox-treated mice. (D) Densitometric analysis for the amount of Orai1 or Trpc1 in immunoprecipitated Stim1 protein. **P<0.01 vs vehicle, n=5/group. (E) Cardiomyocytes were loaded with Fura 2-AM probe and subjected to Ca2+ imaging experiments. (F) Quantification of fluorescence ratio (340/380) representing the thapsigargin (Tg)-induced Ca2+ store release and SOCE in cardiomyocytes. **P<0.01 vs vehicle, n=20. (G) Dox treatment decreased store-operated Ca2+ currents in cardiomyocytes. Average IV curves under vehicle and Dox conditions were shown. (H) Average current intensity was calculated. **P<0.01 vs vehicle, n=15.
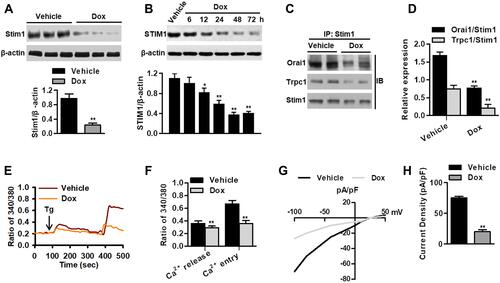
Table 1 Echocardiographic Characteristics of Left Ventricular Parameters in Mice with Different Treatments
Figure 2 Cardiomyocyte Stim1 deficiency enhances Dox-induced myocardial injury. (A and B) Cardiomyocyte-specific Stim1 knockout mice (Stim1CKO) and their control littermates (Stim1f/f) were treated with Dox (15 mg/kg body weight) for 14 days. LDH (A) and cTnT (B) release in serum were measured by a commercial kit. n=12/group. **P<0.01 vs vehicle+Stim1f/f; ##P<0.01 vs Dox+Stim1f/f. (C) Survival curves were recorded until day 40 after the start of Dox treatment. n=20/group. (D) Echocardiography was performed as described in the Methods section. Representative M-mode echocardiography from the four groups of mice with different treatments. n=12/group.
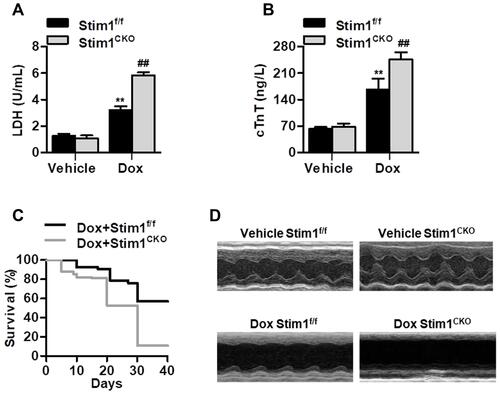
Figure 3 Stim1 overexpression attenuates Dox-induced cardiotoxicity. (A and B) Mice were infected with AAV-Lacz or AAV-Stim1, and then infused with Dox (15 mg/kg of body weight) with an osmotic pump for 14 days. Serum LDH (A) and cTnT (B) concentration was examined. n=13/group. **P<0.01 vs vehicle+AAV-Lacz; ##P<0.01 vs Dox+AAV-Lacz. (C) Survival curves were recorded until day 40 after Dox treatment. n=20/group. (D) Echocardiographic analysis of heart function and representative photographs were shown. n=12/group.
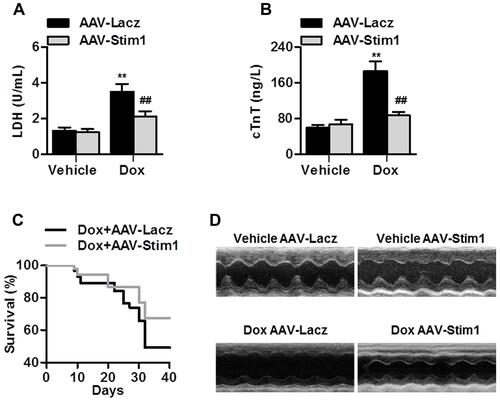
Figure 4 Stim1 knockout exacerbates Dox-induced myocardial apoptosis. (A and B) Cell apoptosis in the cross-sectional area of myocardium from Stim1CKO mice, Stim1f/f mice (A), AAV-Lacz-infected mice and AAV-Stim1-infected mice (B) treated with vehicle or Dox was examined by TUNEL staining. Representative TUNEL (green) and α-actinin (red) stained photographs of cardiomyocytes in myocardial tissues. The nuclei was counterstained with DAPI (blue). n=6/group. Scale bar, 50 μm. (C–J) The protein expression of Bcl-2 and Bax in myocardium from the above groups were determined. Representative images of Western blotting were shown (C and G). Densitometric analysis of Bcl-2 (D and H), Bax (E and I), and the ratio of Bcl-2 to Bax (F and J) were performed. **P<0.01 vs vehicle+Stim1f/f or vehicle+AAV-Lacz; ##P<0.01 vs Dox+Stim1f/f or Dox+AAV-Lacz, n=8/group.
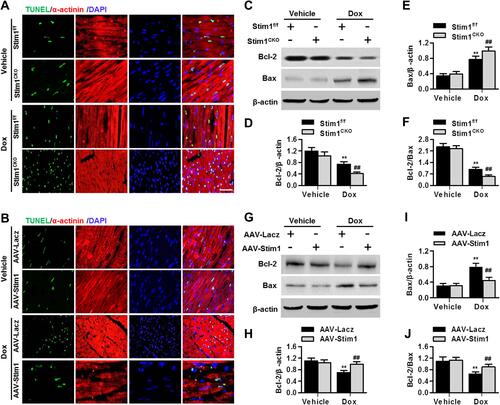
Figure 5 STIM1 deficiency promotes cardiomyocyte apoptosis induced by Dox. (A–D) Cardiomyocytes were treated with negative siRNA (Neg, 40 nmol/L), STIM1 siRNA (siSTIM1, 40 nmol/L) (A), Lacz adenovirus (Ad-Lacz, 40 MOI) or STIM1 adenovirus (Ad-STIM1, 40 MOI) (B) for 24 h in prior to Dox (10 μmol/L) incubation for another 24 h. Cell apoptosis was determined by Annexin V/PI staining followed by flow cytometry (A and B). Quantitative analysis of the percentage of apoptotic cells (C and D). (E and F) After the above-mentioned treatment, cell viability was assessed with CCK-8 assay. (G and H) At the end of the experiment, cell medium were harvested and LDH release was measured. Data were expressed as mean ± SEM. **P<0.01 vs vehicle; ##P<0.01 vs Dox, n=5–8.
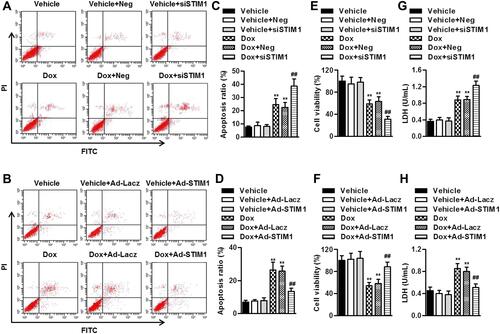
Figure 6 STIM1 downregulation potentiates Dox-induced ER stress. (A–D) AC16 human cardiomyocytes were transfected with STIM1 siRNA (40 nmol/L) (A and C), STIM1 adenovirus (40 MOI) (B and D), or their corresponding negative control, and then incubated with Dox (10 μmol/L) for 1 h. The phosphorylation of PERK (A and B) and eiF2α (C and D) were determined. (E–H) The cells were treated with STIM1 siRNA (E and G) or STIM1 adenovirus (F and H) followed by incubation with Dox (10 μmol/L) for 24 h. The protein expression of ATF4 (E and F) and CHOP (G and H) were determined. Data were represented as mean ± SEM. **P<0.01 vs vehicle; ##P<0.01 vs Dox, n=6.
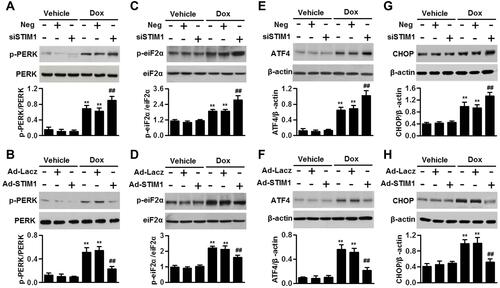
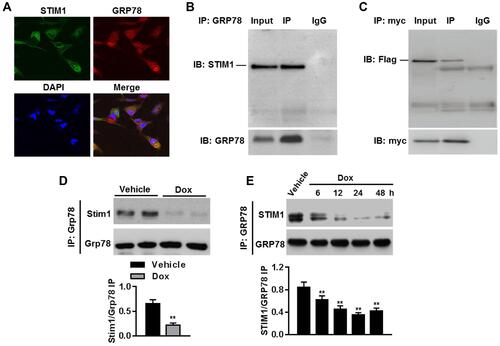
Figure 7 STIM1 relieves ER stress by binding to GRP78 in cardiomyocytes. (A) Representative images of STIM1 and GRP78 distribution in cardiomyocytes. (B) Cell lysates were immunoprecipitated with anti-GRP78 antibody and immunoprecipitated (IP) proteins were immunoblotted (IB) with anti-STIM1 antibody. n=5. (C) Cardiomyocytes were co-transfected with STIM1-flag plasmid and GRP78-myc plasmid. Anti-myc antibody was immunoprecipitated and immunoblotted with anti-flag antibody. n=4. (D) Immunoblotting for Stim1 after immunoprecipitation with anti-Grp78 antibody in myocardium from vehicle- or Dox-treated mice. **P<0.01 vs vehicle, n=6/group. (E) Cardiomyocytes were treated with Dox (1 μmol/L) for different times as indicated. Immunoprecipitation analysis was performed to determine the interaction between STIM1 and GRP78. **P<0.01 vs vehicle, n=4.