Figures & data
Table 1 Primers Used for qPCR
Table 2 Baseline Echocardiographic and Hemodynamic Parameters
Figure 1 Electrophysiology in vivo and ex vivo. (A–F) in vivo. (A) Schematic showing intracardiac electrophysiology. (B) Representative intracardiac electrograms with and without VAs. (C) Incidence of VAs induced by stimuli in vivo. (D) The longest VA duration; one circle indicates data from one mouse. (E) QTc calculated as QT/(RR0.5). (F) Right ventricular effective refractory period (RVERP). WT sham group, n = 25; WT MI group, n = 26; MIF-KO sham group, n = 25; MIF-KO MI group, n = 27. (G–L) ex vivo. (G) Schematic showing intracellular recording at four peri-infarct regions within the isolated hearts: L-M, L-A, R-M, and R-A. (H) Representative field electrocardiograms with and without VAs. (I) Incidence of VAs induced by stimuli ex vivo. (J) The longest VA; one circle indicates data from one heart. (K) The APD90 at four peri-infarct regions. (L) Spatial dispersion of APD90 at four peri-infarct regions. Each group, n = 15. *P < 0.05 vs the sham-operated mice of the same type, #P < 0.05 vs the WT mice underwent the same operation.
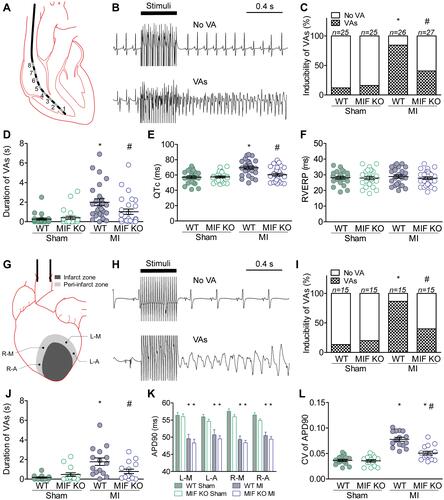
Figure 2 Echocardiographic parameters at three days after surgery. (A) Heart rates. (B) Left ventricle end diastolic dimensions (LVEDDs). (C) Left ventricle end systolic dimensions (LVESDs). (D) Ejection fractions (EFs). (E) Fractional shortening (FS). (F) Stroke volumes (SVs). WT sham group, n = 25; WT MI group, n = 26; MIF-KO sham group, n = 25; MIF-KO MI group, n = 27. *P < 0.05 vs the sham-operated mice of the same type.
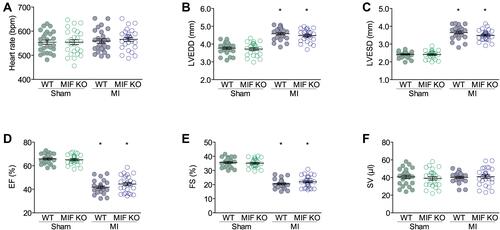
Figure 3 Hemodynamic measurements of blood pressure and left ventricle pressure after MI surgery. (A) Systolic arterial blood pressure (SBP). (B) Diastolic arterial blood pressure (DBP). (C) Left ventricle peak systolic pressure (LVPSP). (D) Left ventricle end diastolic pressure (LVEDP). (E) Left ventricle +dP/dTmax (+dP/dTmax). (F) Left ventricle –dP/dTmax (–dP/dTmax). For each group, n = 8. *P < 0.05 vs the sham-operated mice of the same type.
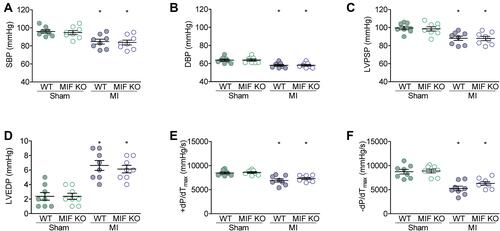
Figure 4 Effects of MIF-KO on interstitial fibrosis and norepinephrine (NE) levels. (A) Representative heart sections with Masson’s trichrome staining on day 3 after surgery. (B) Comparison of interstitial fibrosis between WT and MIF-KO groups. (C) NE level in plasma. (D) NE content in the peri-infarct myocardium. Each group for interstitial fibrosis identification, n = 5. Each group for NE content measurement, n = 6. *P < 0.05 vs the sham-operated mice of the same type. Scale bar, 100 μm.
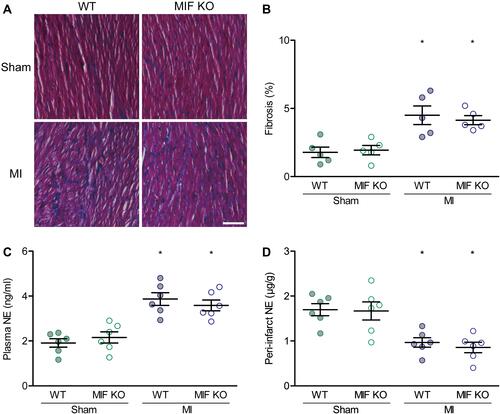
Figure 5 Effects of MIF on inflammatory cells, gap-junctions, and sympathetic reinnervation in the peri-infarction myocardium. (A) F4/80- and DAPI-stained ventricular sections and the statistical results. The green indicates stained macrophages. (B) Comparison of F4/80-stained macrophages among the four groups. (C) Cx43- and TnT-stained ventricular sections and the statistical results. The red indicates stained gap-junctions. (D) Comparison of morphometry for Cx43 among the four groups. (E) Comparison of Cx43 lateralization among the four groups. (F) TH- and DAPI-stained ventricular sections and the statistical results. The red indicates stained sympathetic nerves. (G) Comparison of TH-stained sympathetic nerve fibers among the four groups. Each group, n = 6. *P < 0.05 vs the sham-operated mice of the same type, #P < 0.05 vs the WT mice underwent the same operation. Scale bar, 20 μm.
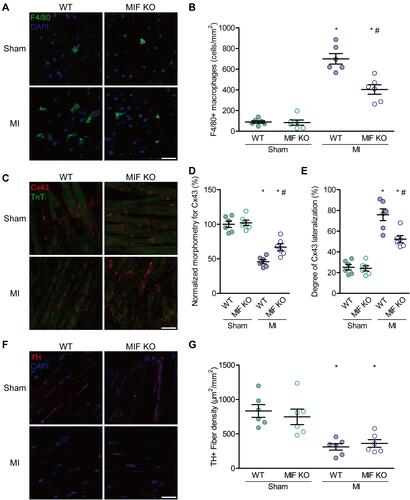
Figure 6 Effects of MIF on inflammatory mediators in the peri-infarction zone. (A) TNF-α, and (B) IL-1β mRNA levels in the four groups. Each group, n = 6. *P < 0.05 vs the sham-operated mice of the same type, #P < 0.05 vs the WT mice underwent the same operation.
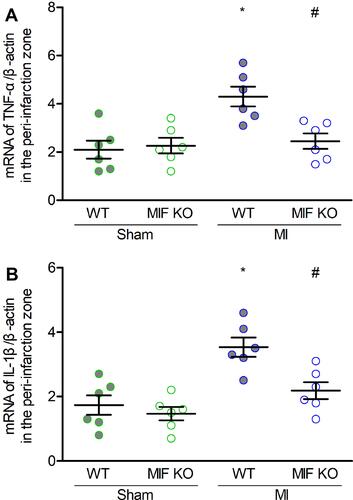
Figure 7 Effects of macrophage depletion on MI-induced ventricular arrhythmias (VAs) and their relationships with Cx43 and inflammatory mediators. (A) Incidence of VAs after macrophage depletion in vivo. (B) The longest VA durations in vivo; one circle indicates data from one mouse. (C) Incidence of VAs after macrophage depletion ex vivo. (D) The longest VA durations ex vivo; one circle indicates data from one heart. (E) Representative F4/80 and Cx43 co-stained ventricular sections (upper), and TnT and Cx43 co-stained ventricular sections (lower). (F) Statistical results of F4/80-stained macrophages. (G) Statistical results of Cx43-stained gap-junctions. (H) Statistical results of Cx43 lateralization. (I) TNF-α, and (J) IL-1β mRNA levels measured with qPCR between the two groups. For each group, n is reported in the corresponding column or is indicated by the number of circles. No significant difference was found (P > 0.05).
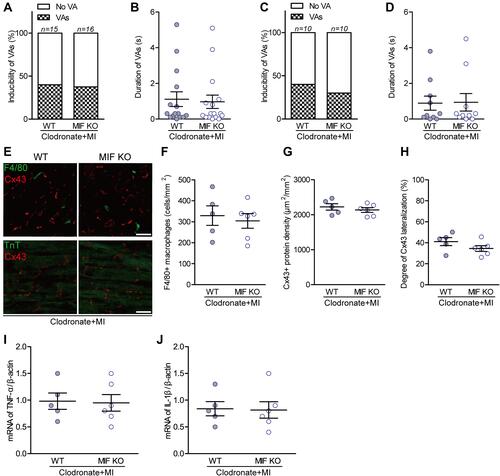
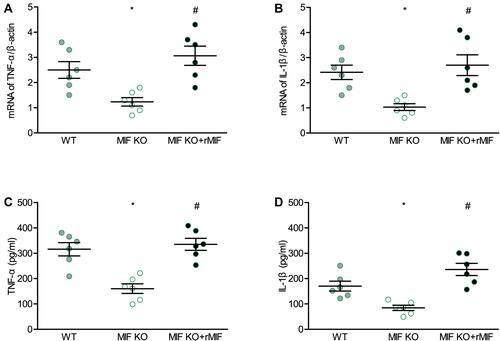
Figure 8 Effects of MIF deficiency and exogenous recombinant MIF replenishment on inflammatory mediators in cultured peritoneal macrophages from mice. (A) TNF-α, and (B) IL-1β mRNA levels measured with qPCR. (C) TNF-α, and (D) IL-1β secretion levels measured with ELISA. For each group, n = 6. *P < 0.05 vs the WT group, #P < 0.05 vs the MIF KO group.