Figures & data
Figure 1 The flowchart of experiments in vivo (A) and in vitro (B).
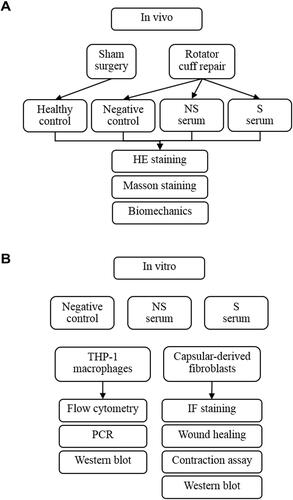
Table 1 Sequences of Target Genes
Figure 2 The flowchart of patient inclusion and exclusion.
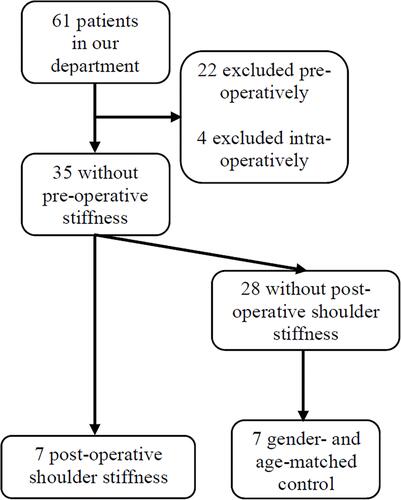
Table 2 General Characteristics and Baseline Conditions
Table 3 Pre-, Intra- and Post-Operative Data
Figure 3 The impact of different injection materials on the histological and biomechanical appearance of mice shoulders with immobilization. (A) The representative image of joint capsule of the shoulder on HE staining and Masson staining. (B) The quantification of capsule thickness and inter-group comparison. (C) The schematic image of the method to measure passive range of motion and the quantification. The yellow arrow in A indicated the hypercellular status of joint capsule. The yellow line in A indicated the inner and outer border of joint capsule. The red dotted arch indicated the angle of the glenohumeral joint under a certain torque, which represented the range of motion to be measured. N=7. *p<0.05, ***p<0.001. Bar: 200μm.
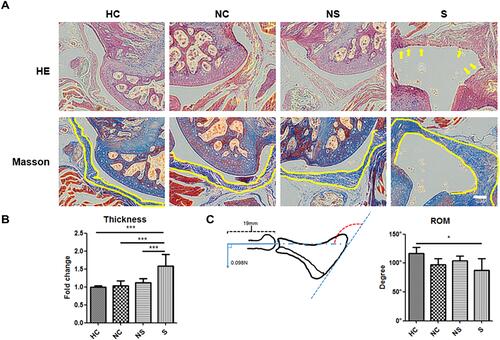
Figure 4 The phenotype in THP-1 macrophages under stimulations of serum with different origins. (A) The representative image of flow-cytometry of CD206 expression and CD86 expression in THP-1 macrophages with different stimulations. (B) The quantification of CD206 expression in THP-1 macrophages with different stimulations. (C) The quantification of CD86 expression in THP-1 macrophages with different stimulations. (D) The expression of Smad3 and p-Smad3 in THP-1 macrophages with different stimulations, and related quantification (E and F). N=7. ***p<0.001.
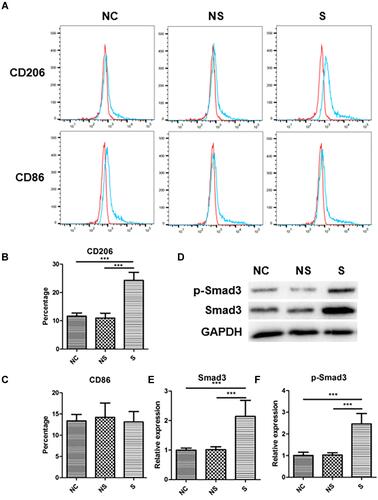
Figure 5 The expression of M2 markers and M1 markers in THP-1 macrophages under stimulations of serum with different origins. M2 markers were shown in upper row while M1 markers in lower row. N=7. **p<0.01, ***p<0.001.
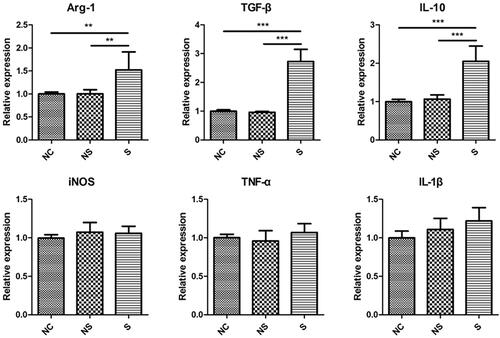
Figure 6 The level of fibroblast activation under stimulations with serum from different origins. (A) The representative image of immunofluorescent staining of α-SMA in fibroblasts in different groups. (B) The quantification of the positive area of α-SMA relative to the total image in different groups. (C) The expression of Smad3 and p-Smad3 in fibroblasts with different stimulations, and related quantification (D and E). N=7. **p<0.01, ***p<0.001. Bar: 50μm.
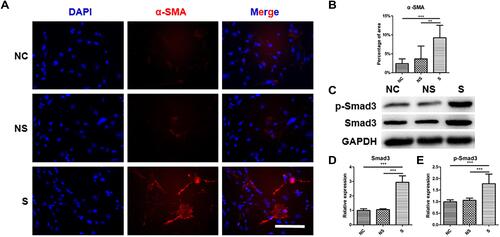
Figure 7 The migration and contraction ability of fibroblasts under stimulations of serum with different origins. (A) The representative image of fibroblasts migration under different stimulations (yellow dotted line indicated the border of cells that reached). (B) The relative quantification of migration distance of fibroblasts in different groups compared to that of group NC at 12h. (C) The relative quantification of migration distance of fibroblasts in different groups compared to that of group NC at 24h. (D) The representative image of the ability of collagen contraction of fibroblasts in different groups (yellow dotted line indicated the collagen gel). (E) The relative quantification of the area of collagen gel in different groups compared to that of group NC at 12h. (F) The relative quantification of the area of collagen gel in different groups compared to that of group NC at 24h. The yellow dotted line in (A) indicated the distance between fibroblasts at two sides of the gap. The yellow dotted cycle in (D) indicated the area of collagen gel. N=7. *p<0.05, ***p<0.001. Bar: 100μm.
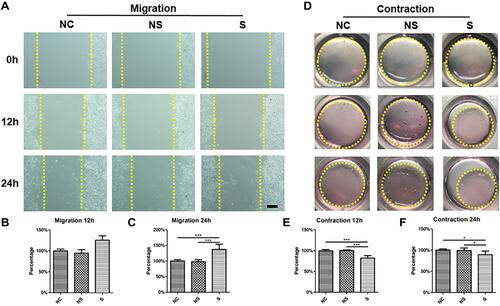
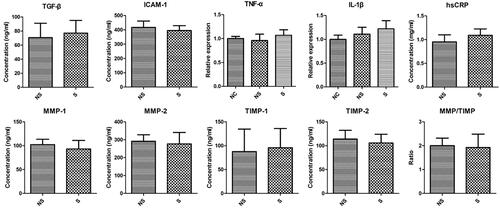
Figure 8 The concentration of various cytokines in the serum of patients in two groups.