Figures & data
Figure 1 MCTR1 ameliorated BLM-induced lung fibrosis in mice in a dose-dependent. Mice were treated with bleomycin (BLM, 2.0mg/kg, i.t.) or the same volume saline on day 0. From day 7, mice received MCTR1 at 1μg/mouse, 100ng/mouse, or 10ng/mouse, followed by boosted at 1/10 of the initial dose every other day. Representative images of lung tissue sections stained with (A) hematoxylin-eosin (HE) and (B) Masson’s trichrome treatment with different doses of MCTR1, scar bar: 1mm. (C) Acute lung injury score and (D) Ashcroft score of lung tissue section of mice in each group. (E) Body weight of mice in each group. Date are presented as the mean ±SEM. n=5. *P < 0.05, **P < 0.01.
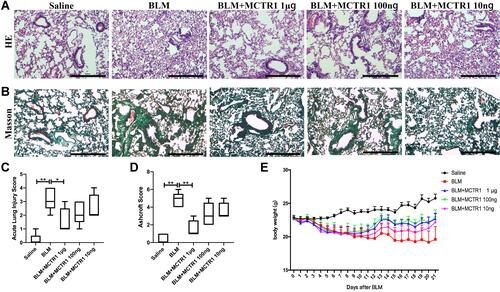
Figure 2 MCTR1 reduced the production of cytokines related to inflammation and fibrosis. Mice were treated with bleomycin (BLM, 2.0mg/kg, i.t.) or the same volume saline on day 0. From day 7, mice received MCTR1 at 1μg/mouse, followed by boosted 100ng/mouse every other day. ELISA kits measuring the expression of TNF-α (A), IL-1β (B), IL-6 (C) and TGF-β (D) were shown. Date are presented as the mean ±SEM. n=5. *P < 0.05, **P < 0.01.
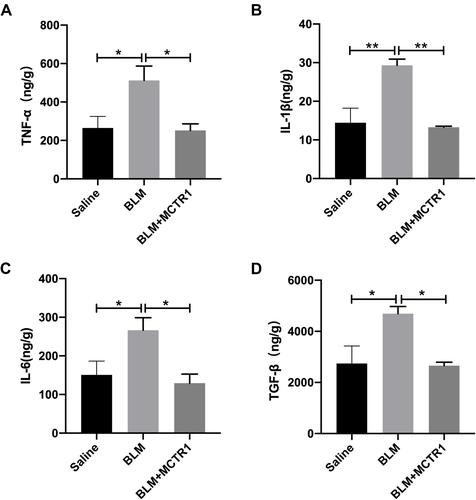
Figure 3 MCTR1 protected BLM-induced epithelial cells destroy and reduced collagen deposition. Mice were treated with bleomycin (BLM, 2.0mg/kg, i.t.) or the same volume saline on day 0. From day 7, mice received MCTR1 at 1μg/mouse, followed by boosted 100ng/mouse every other day. Representative images of transformation electron microscope of type II alveolar epithelial cells ultrastructural analyses (A) and collage deposition (B) were shown. The arrow indicates lamellar bodies (A) and collagen (B), scar bar: 0.5µm (A) and 1μm (B). (C) The contention of hydroxyproline in the lung tissues of mice in each group. Date are presented as the mean ±SEM. n=5. *P < 0.05, **P < 0.01.
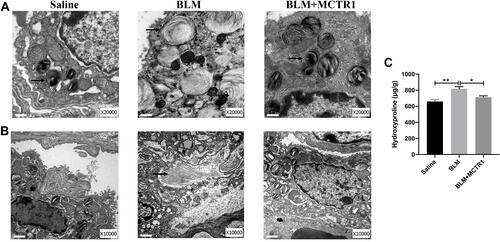
Figure 4 MCTR1 inhibited epithelial-to-mesenchymal transition in vivo after BLM challenge. Mice were treated with bleomycin (BLM, 2.0mg/kg, i.t.) or the same volume saline on day 0. From day 7, mice received MCTR1 at 1μg/mouse, followed by boosted 100ng/mouse every other day. After 21 days, lung tissues were processed to measure the mRNA levels and protein levels of EMT markers by RT-PCR and Western blot respectively. The mRNA levels of mesenchymal markers α-SMA (A) and N-cadherin (B), and epithelial marker E-cadherin (C) in mouse lung tissues were shown. Representative the protein blotting images of α-SMA and E-cadherin (D) in the lung tissues in mice of each group and summarized data (E and F) were shown. Date are presented as the mean ±SEM. n=5. *P < 0.05, **P < 0.01.
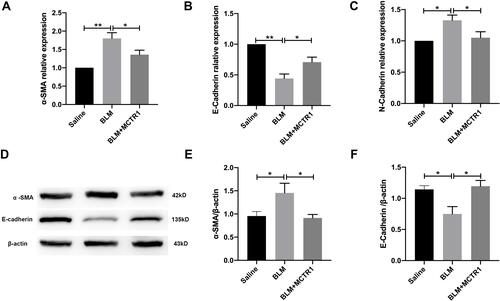
Figure 5 MCTR1 restored lung function in BLM-induced lung fibrosis in mice. Mice were treated with bleomycin (BLM, 2.0mg/kg, i.t.) or the same volume saline on day 0. From day 7, mice received MCTR1 at 1μg/mouse, followed by boosted 100ng/mouse every other day. Then lung function was measured by the flexiVent system. (A) inspiratory capacity (IC), (B) Pressure-volume loop curves (P-V loop), (C) static compliance (Cst), (D) A (total lung capacity), (E) K (form of deflating P-V loop) were shown. Date are presented as the mean ±SEM. n=5. *P < 0.05, **P < 0.01.
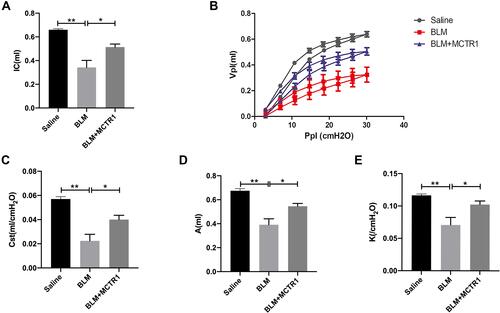
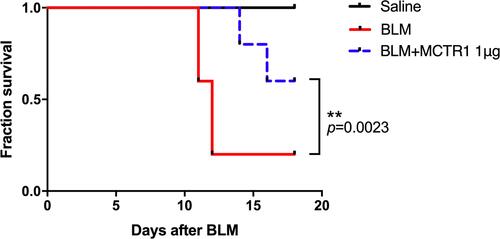
Figure 6 MCTR1 enhanced survival rate of lung fibrotic mice. Mice were treated with bleomycin (BLM, 2.5 mg/kg, i.t.) or the same volume saline on day 0. From day 7, mice received MCTR1 at 1μg/mouse, followed by boosted 100ng/mouse every other day. The survival curve was shown. n=8, **P < 0.01.