Figures & data
Figure 1 PRISMA flow-chart of the study selection criteria for the included article reports.
Notes: Adapted from Moher D, Liberati A, Tetzlaff J, Altman DG; PRISMA Group. Preferred reporting items for systematic reviews and meta-analyses: the PRISMA statement. PLoS Med. 2009;6(7):e1000097. © 2009 Moher et al. Creative Commons Attribution License.Citation39
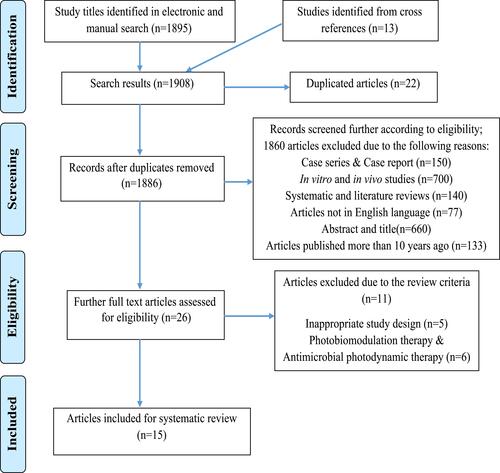
Table 1 Shows a Tabular Representation of All the Eligible Randomized Controlled Trials Studies in Terms of Demography, Study Design, Journal Published in Peer Reviewed Journal, Industry Funds, Ethical Approval, Intervention Groups, Number of Laser Session After SRP Influencing Factors (Systemic Diseases and Smoking), Treatment Duration and Percentage of Documentation
Figure 2 Illustrates the percentage of the gender distribution according to the number of the recruited subjects.
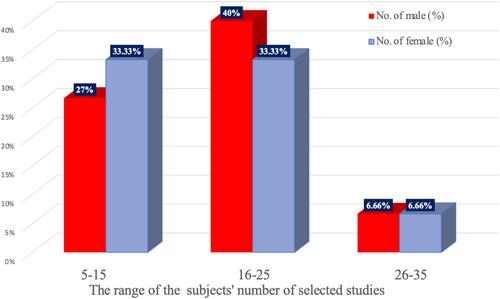
Table 2 Shows a Tabular Representation of Diode Laser-Assisted Treatment Parameters Reported in the Included Eligible Randomized Controlled Trials Studies
Figure 3 Illustrates the percentage of various wavelengths utilised in the selected studies and the number between brackets shows the number of the studies in which wavelength used.
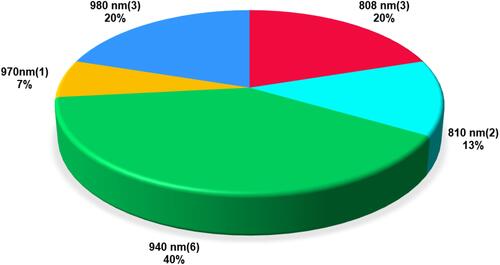
Figure 4 Shows the percentage of the recruited pocket depth measurements in relation to the utilized wavelengths.
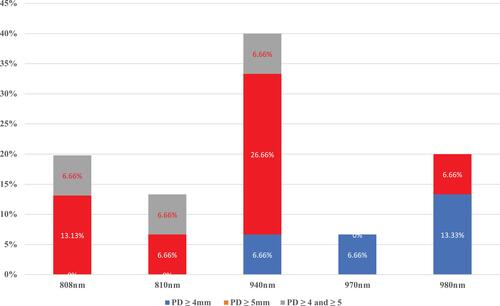
Figure 5 Shows the percentage of the missing data related to the laser parameters.
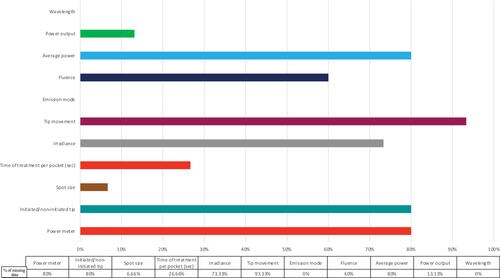
Table 3 Illustrates the Methods of Assessment for All the Eligible Randomised Controlled Studies, Which Were the Clinical Parameters (PD/PPD, PI, BOP, GI, CAL, GL, API, MGI), Microbiological Analysis (CFU, PCR), Biochemical Markers (CRP, GCF, ROM, HbA1C), as Well the Number of Assessed Variables in Each Study
Table 4 Illustrates the Outcomes and the Follow-Up Period of the Eligible Studies
Table 5 Shows the Summary of the Statistical Significance Improvement in the Clinical, Microbiological and Immune-Biochemical Parameters and Markers for SPR Alone Group, SPR + Laser Group, as Well the Difference Between SPR Alone Group and SPR + Laser Group at Various Follow-Up Time-Points
Figure 6 Quality assessment of all the included eligible studies (n=15) in 4 domains and overall bias. Studies were graded as low risk (green), moderate risk (some concerns, yellow) or high risk (red) for each domain. There is no summation across fields. The assessment was performed using RoB tool for randomised trials, Version 2.0 (RoB 2).Citation40,Citation41
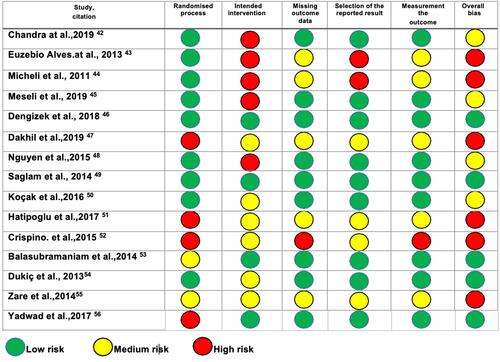
Figure 7 Risk of bias assessment graph of all the included studies expressed as percentages for 4 main domains as well overall bias, based on the agreed answers across two independent authors (MM and RH). The assessment was performed using RoB tool for randomised trials, Version 2.0 (RoB 2).Citation40,Citation41
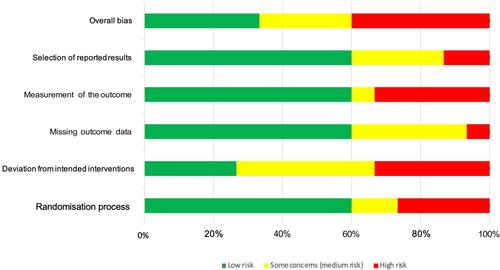
Figure 8 Shows the summary of the risk of Bias assessment of all the domains of the included studies based on agreed answers across two independent authors (MM &RH). The assessment was performed using RoB tool for randomised trials, Version 2.0 (RoB 2).Citation40,Citation41
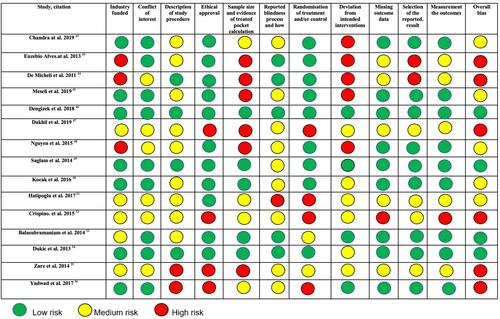
Figure 9 Risk of bias assessment graph of all the included studies for all the domains expressed as percentages, based on agreed answers across two independent authors (MM and RH). The assessment was performed using RoB tool for randomised trials, Version 2.0 (RoB 2).Citation40,Citation41
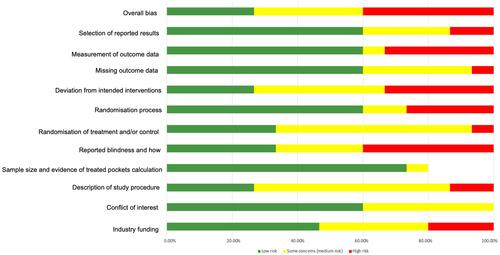
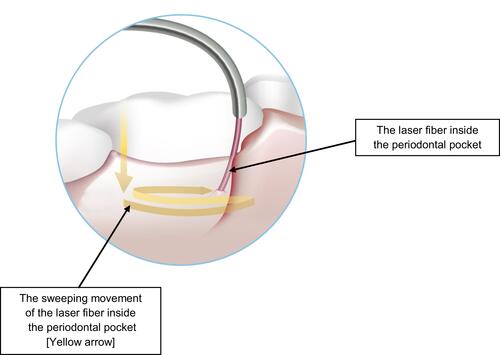
Figure 10 Illustrates the spiral movement of the laser fiber (arrow in yellow) inside the periodontal pocket by which 14 of the selected studies in this systematic review utilized.