Figures & data
Figure 1 Secretory FGFs and their FGFRs expressions in balloon-injured rat left carotid artery. The balloon injuries were performed in rat LCA. The whole LCA were harvested at times as indicated post injury for qPCR (A), Western blotting (B) and IHC (E). (A) The mRNA fold change of 15 FGFs and 4 FGFRs were organized into a heat-map. Red box indexes the FGF10 and FGFR2. (B–D) Representative Western blotting (B) images and quantitative analyses of FGF10 and FGFR2 protein expression in the whole LCA (C and D) were shown. (E–G) Representative IHC images (E) and summaries of FGF10 positive cells and FGFR2 stained cells (E and G) were illustrated. Bar=50μm. n=6. *p<0.05 and **p<0.01 vs Ctl.
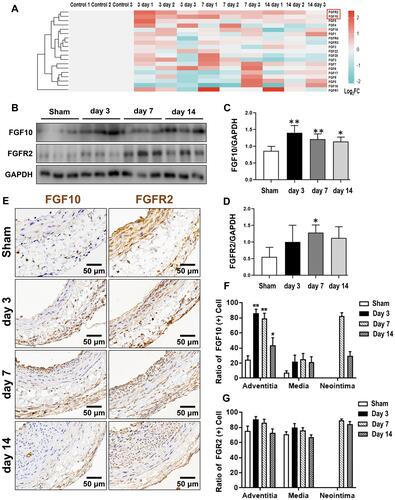
Figure 2 PDGF differentially regulates expression of FGF10 and FGFR2 in VECs, VSMCs and VAFs. VECs, VSMCs and VAFs were isolated from rat aorta and cultured. (A) Morphological features of VECs, VSMCs and VAFs in primary cultures. Bar=200μm. (B) Immunofluorescence staining of CD31, α-SMA and Vimentin in three types of cells. Nuclei were stained with DAPI. Bar=20μm. (C and D) Representative WB images (C) and summaries (D) of FGF10 and FGFR2 protein expressions in three types of cells with or with put treatment of PDGF (20ng/mL). n=3. *p<0.05 and **p<0.01.
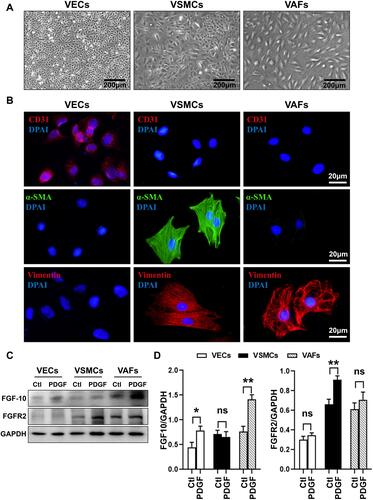
Figure 3 Both exogenous and VAFs-derived FGF10 promote the proliferation and cell cycle of VSMCs. (A) In cultured VAFs, knocking-down efficiency of FGF10 by siRNA was determined by WB. (B and C) Relative VSMCs numbers under different experimental conditions were analyzed by CCK-8 proliferation assay. (D) The schematic illustration of VAFs-VSMCs co-culture system. The co-cultured VSMCs were used for flow cytometry and Western blotting test. (E) In this co-cultured system, the concentrations of VAF-derived FGF10 in different experimental conditions as indicated were measured by Elisa. (F) Cell cycle progression in VSMCs under different experimental conditions were evaluated by using propidium iodide staining (flow cytometry). (G) Cyclin D1 expressions in co-cultured VSMCs were analyzed by WB and its quantitative analysis. n=3. *p<0.05, **p<0.01 compared with Ctl. #p<0.05, ##p<0.01 between two groups as indicated.
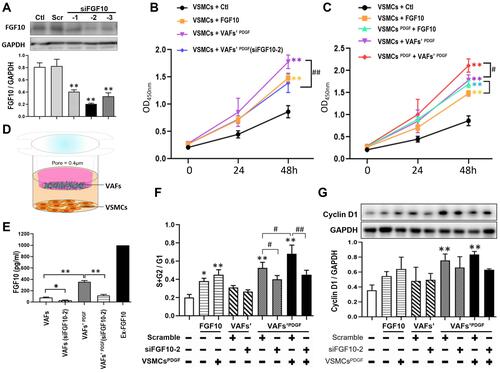
Figure 4 Both exogenous FGF10 and VAFs-derived FGF10 promote VSMCs migration. (A and C) Evaluation of VSMCs migration by Transwell assay (A) and scratching assay (C) and quantitative analyses (D and E). (B) Schematic illustration of VAFs-VSMCs co-cultured system in which co-cultured VSMCs were used for scratching assay and WB analyses of MMP2 and MMP9. (F–H) Representative WB images (F) and their quantitative analyses (G and H) of MMP2 and MMP9 protein expressions in co-cultured VSMCs under different conditions as indicated. n=3. *p<0.05, **p<0.01 compared with Ctl. #p<0.05, ##p<0.01 between two groups as indicated.
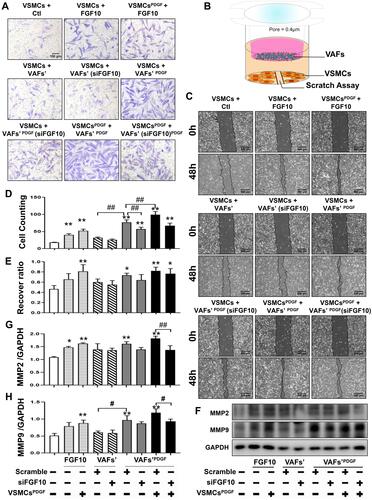
Figure 5 The activities of FGFR2 in VSMCs in vivo and in vitro. (A and C) Representative IHC images of P-FGFR2 staining (A) and its quantitative analysis (C) in rat LCA sections harvested at indicated times after balloon-injury. Scale bar=50μm, n=6. (B and D) Representative immunofluorescence images of P-FGFR2 staining (B) and its quantitative analysis (D) in cultured VSMCs under conditions as indicated. Scale bar=20μm, n=3. (E–G) The protein expression of P-FGFR2 in co-cultured VSMCs under conditions described in were analyzed by WB (E) and its quantitative analyses (F and G), n=3. *p<0.05; **p<0.01 vs Ctl. #p<0.05; ##p<0.01 between two groups as marked.
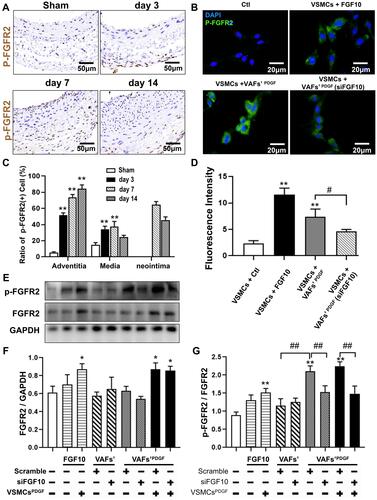
Figure 6 FGF10 regulates MAPK and PI3K-AKT pathways in VSMCs. MAPK and PI3K signaling molecules in co-cultured VSMCs under conditions exactly same to were analyzed by WB (A) and their quantitative analyses (B), n=3. *p<0.05; **p<0.01 vs Ctl. #p<0.05; ##p<0.01 between two groups as marked.
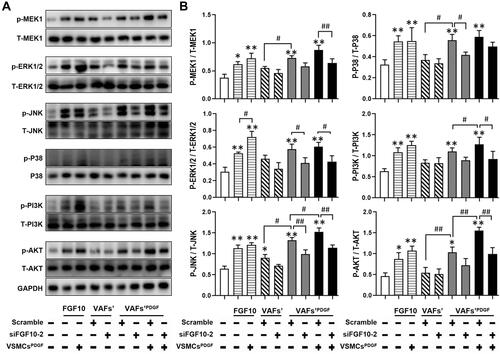
Figure 7 PCNA expressions were upregulated by FGF10 in vivo. The balloon injuries were performed in rat LCA with or without deliveries of exogenous FGF10 or siFGF10-2 and the whole LCA were harvested on day 14 post the procedure for staining of FGF10, PCNA and DAPI. Bar=200μm. n=5.
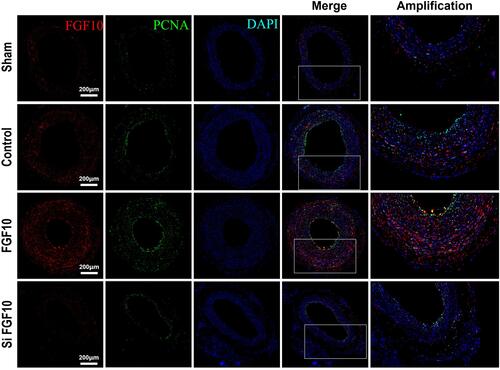
Figure 8 MMP9 expressions were upregulated by FGF10 in vivo. The balloon injuries were performed in rat LCA with or without deliveries of exogenous FGF10 or siFGF10-2 and the whole LCA were harvested on day 14 post the procedure for staining of FGF10, MMP9 and DAPI. Bar=200μm, n=5.
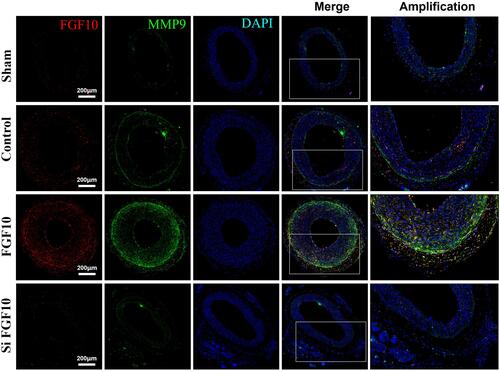
Figure 9 FGF10 potentiated balloon injury-induced neointima formation. The balloon injuries were performed in rat LCA with or without deliveries of exogenous FGF10 or siFGF10-2 and the whole LCA were harvested on day 14 post the procedure for HE staining (A) and quantitative analyses (B) of the neointima. Bar=200μm. n=6. **p<0.01 vs Ctl; ##p<0.01 vs FGF10.
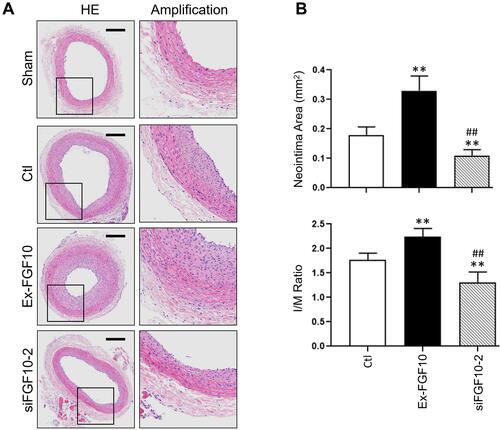
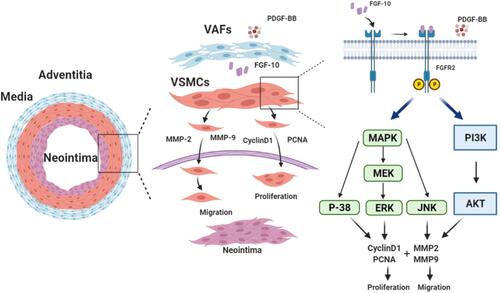
Figure 10 Schematic summary of VAFs-derived FGF10 and FGF10-FGFR2 signaling axis promotes VSMCs proliferation and migration in vitro and the neointima formation in vivo.