Figures & data
Figure 1 Increased CDH11 expression and fibrosis in the LA appendage tissues of patients with atrial fibrillation. LA tissues were obtained from patients with sinus rhythm (SR) or chronic atrial fibrillation (AFib). (A) CDH11 transcripts in the LA tissues of patients with SR or AFib were measured by quantitative RT-PCR. (B) Representative Western blotting images showing protein levels of CDH11, α-SMA, CTGF from patient atrial muscle tissues as indicated. GAPDH was used as internal control for protein normalization. Quantification of the band intensity for each protein was summarized in bar graphs. (C) Representative images of immunohistochemical staining of LA tissues from patient with SR or AFib as indicated. CDH11 levels were quantified and summarized in the bar graph on the left. Bar=100 μm. (D) Representative images of picrosirius red staining of the left atrial tissue for collagen (red staining) from patients with SR or AFib. Bar graph on the left summarized the area of fibrosis. Bar=100 μm. N=6. Data are presented as mean ± SD. *: p<0.05, **: p<0.01, ***: p<0.001 vs SR.
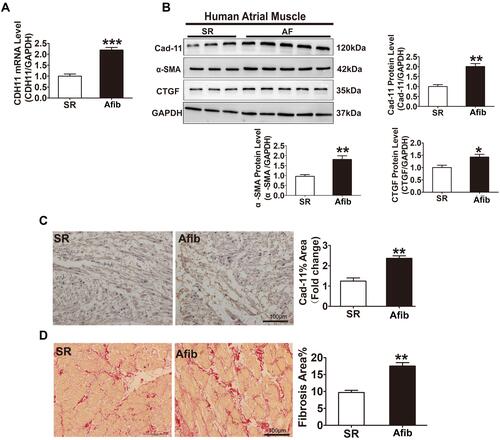
Figure 2 Loss of CDH11 suppressed pro-fibrotic gene expressions in mouse AFs. Atrial fibroblast cells isolated from CDH−/- and WT mice were cultured and treated with Ang-II for 24h, followed by RNA extraction for RNA-Seq analysis. (A) Volcano plots of normalized counts comparing the transcriptomes of atrial fibroblasts from CDH11−/- and control WT mice. A total of 891 transcripts were found to differentially expressed (DEGs) between WT and CDH−/- at resting state (Left) and 1,263 differentially expressed transcripts after Ang-II stimulation (Right). (B) DAVID functional annotation analysis showed that gene functions related to ECM were significantly down-regulated. (C) KEGG pathway analysis of Ang-II-induced DEGs showed a strong enrichment for signalling pathways associated with proliferation, fibrosis and inflammation. (D) Heat map representing color coded expression levels of DEGs, showing that 39 fibrosis-related genes were significantly up-regulated by Ang-II in WT mice, but this up-regulation was abrogated in CDH−/- AFs. € qRT-PCR analysis of eight fibrosis-related gene expression. Data were presented as mean ± SD. *: p<0.05, **: p<0.01, ***: p<0.001 vs WT; #: p<0.05, ##: p<0.01 vs WT+ Ang-II.
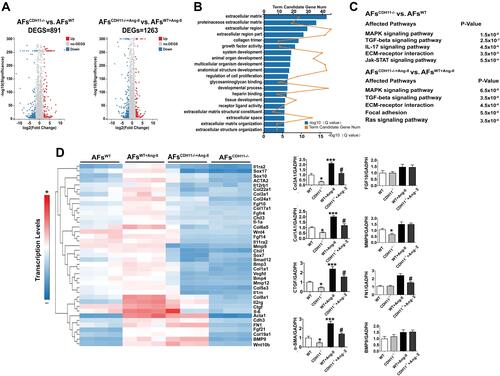
Figure 3 Loss of CDH11 slowed Ang-II-stimulated AFs’ activation, ECM synthesis, collagen lattice contraction and migration. AF cells isolated from CDH−/- and WT mice were cultured and treated with Ang-II for 24h, followed by harvesting for the following analyses. (A) Expression of CDH11 and four major ECM proteins were measured by Western blotting in WT and CDH11−/- cells with or without Ang-II stimulation (1μM, 24h). (B-D) Representative images and bar graph summarization of immunofluorescence staining for α-SMA (B), collagen gel contraction assay (C), and Burden chamber assay for cell migration (D), in mouse AFs with or without Ang-II stimulation. In (B) green: α-SMA; blue: DAPI; Bar=100 μm. Data are presented as mean ± SD for (A-C) and as mean ± SE for D. *: p<0.05, **: p<0.01, ***: p<0.001 vs WT; #: p<0.05 vs WT+Ang-II.
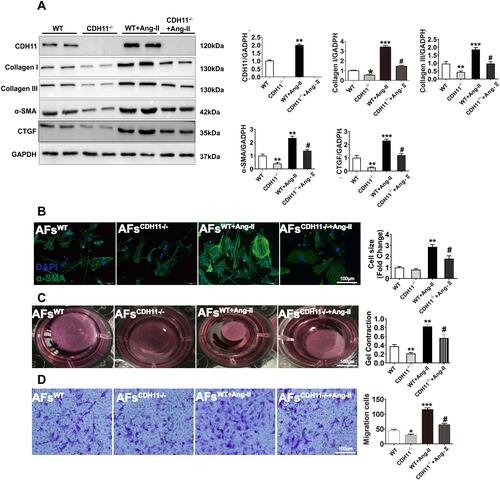
Figure 4 Loss of CDH11 significantly inhibited Ang-II-induced AFs proliferation. AF cells isolated from CDH−/- and WT mice were cultured and treated with Ang-II for 24h, followed by harvesting for multiple analysis. (A) Effect of CDH11 null on the viability of AF cells after serum-starvation for 24 hours followed by Ang-II or control treatment as indicated. (B) Representative images and summaries of flow cytometry to determine cell cycle stages. AF cells at a density of 6×10³ cells/cm2 maintained in DMEM in 0% serum for 24 h to arrest and synchronize the cell growth at G0/G1 phase. Then, the cells were incubated in the DMEM supplemented with Ang-II. Twenty-four hours later, cells were harvested for determinations of the cell cycle progression by flow cytometry after staining of propidium iodide. N=4~6. Data are presented as mean ± SD. *: p<0.05, **: p<0.01, ***: p<0.001 vs WT. #: p<0.05, ##: p<0.01 vs WT+Ang-II.
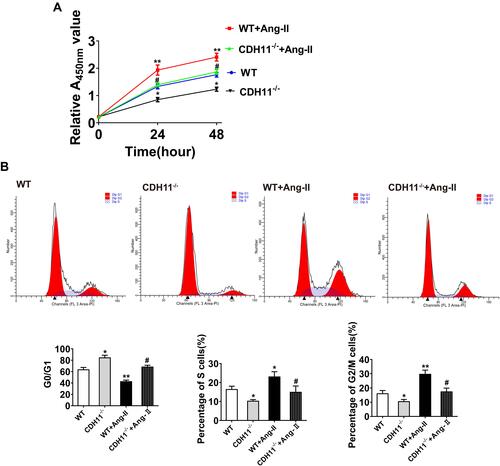
Figure 5 CDH11-Fc induced atrial fibroblast activation and migration. AFs were isolated from WT mice, cultured and serum-starved for 24h, followed by treatment of hCDH11-Fc (10μg/mL; 24h). (A-E) Illustrated hCDH11-Fc mediates changes in (A) α-SMA expression and cell morphologies by immunostaining; (B) contraction of fibroblast-populated collagen lattices by collagen gel contraction assay; (C) mRNA levels of Col1A1 and α-SMA by qRT-PCR and (D) protein levels of Collagen I/III, α-SMA and CTGF by Western blotting. Cell migrations was assayed by transwell (E). Data are presented as mean ± SD for (C and D) and mean ± SE for E. *: p<0.05, **: p<0.01, ***: p<0.001 vs hIgG1.
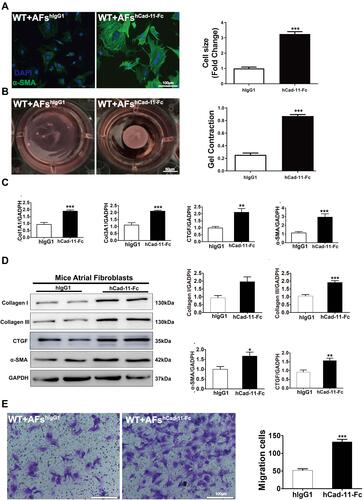
Figure 6 Loss of CDH11 alleviated LA remodeling and susceptibility to atrial fibrillation in Ang-II-infused mice. Both WT and CDH−/- mice were received continuous infusion of saline or Ang-II (1 μM) for 28 days. (A and B) On the 28th day, the mice were received echocardiography exams (A) for measurement of LA dimension and electrophysiological studies for surface and intra-cardiac ECG tracings (B). (C and D) Representative images and bar graph summaries of Western blotting for ECM protein levels (C) and picrosirius red staining for collagens (D) of the LA tissues. Bar=100 μm; N=6 animals for each group. Data are presented as mean ± SD. *: p<0.05, **: p<0.01, ***: p<0.001 vs WT. #: p<0.05 vs WT+Ang-II.
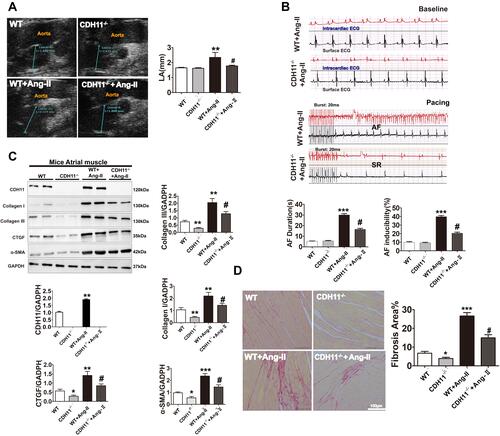
Figure 7 Loss of CDH11 alleviated Ang-II-induced collagen-III synthesis in LA tissue. Both WT and CDH−/- mice were received continuous infusion of saline or Ang-II (1 μM) for 28 days, following by harvesting LA tissues for immunofluorescent staining. Double immunostaining of (A) Vimentin (red) and CDH11 (green) or (B) Vimentin (red) /Collagen-III (green) were carried out on LA tissues from WT or CDH11−/- mice in presence or absence of Ang-II treatment. Dapi stained for nuclei (blue).
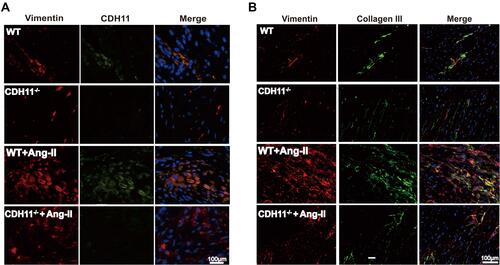
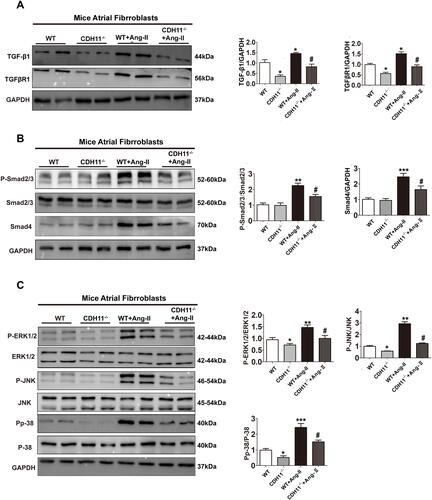
Figure 8 Loss of CDH11 blocked the activation of Smad2/3 and MAPK pathways during Ang-II-induced AFs differentiation. AF cells isolated from CDH−/- and WT mice were cultured and treated with Ang-II for 24h, followed by harvesting for multiple analysis. (A-B) Representative Western blotting image showing the protein levels in AFs from control or CDH11-/- mice in presence or absence of Ang-II (1 μM) treatment. Bar graph on the left quantified respective protein level: (A) TGF-β1 and TGFRβ1; (B) phospho-smad2/3 and smad4; (C) phosphor-ERK1/2, phosphor-JNK, and phosphoP38. Data are presented as mean ± SD. *: p<0.05, **: p<0.01, ***: p<0.001 vs WT: #: p<0.05 vs WT+Ang-II.