Figures & data
Figure 1 Workflow chart of the study.
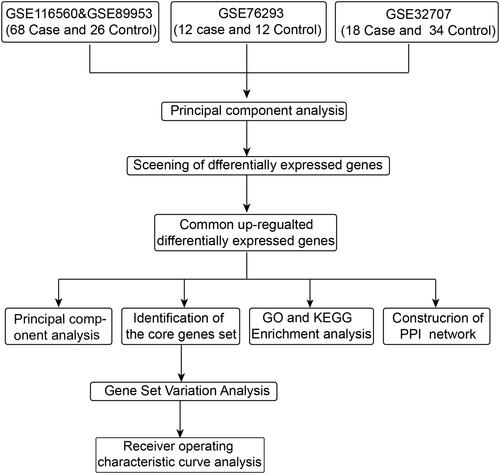
Figure 2 Multiple genes identified as cARDSAMGs. (A) Manhattan plot for DEGs. The three most significantly overexpressed genes are marked in yellow and labeled with their names. (B) Venn diagram to identify upregulated DEGs common to datasets from the three platforms.
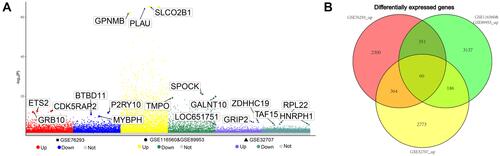
Figure 3 Biological significance of cARDSAMGs. (A) The significantly enriched biological processes, (B) KEGG pathways and (C) GO network in circulating ARDS involving alveolar macrophage-related genes in the three datasets. Different colors of nodes represent different functional groups.
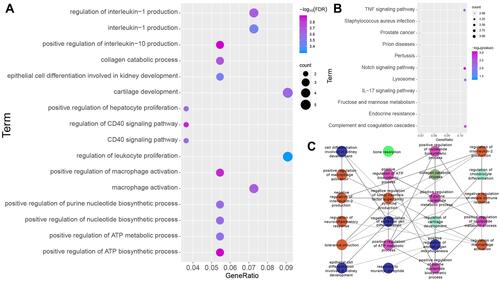
Figure 4 Core genes in the PPIs network of ARDS. (A) PPIs network for alveolar macrophage-related genes in circulating acute respiratory distress syndrome. Ellipses represent genes; diamonds, pathways; and font size, relative degree. (B) Core genes and pathways of interest. (C) Semantic similarities among GO terms for the eight core genes. (D) Weight value of the eight core genes in the three datasets.
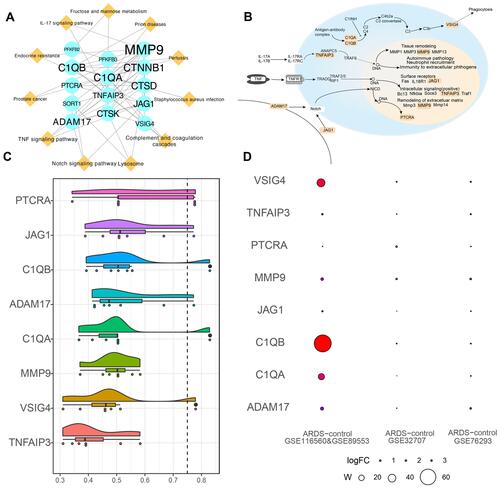
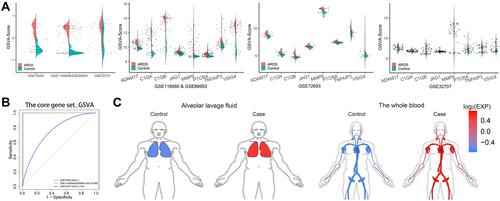
Figure 5 CGSVA score may serve as a circulating biomarker for ARDS. (A) a, GSVA scores of the core gene set in the three datasets. Expression of core genes in (b) GSE76293, (c) GSE116560 & GSE89953 and (d) GSE32707. (B) ROC curves of the gene set GSVA score in the three datasets. (C) The GSVA scores in alveolar whole blood (GSE76293 and GSE32707) and lavage fluid (GSE116560 and GSE89953) were higher for patients with ARDS than for controls.