Figures & data
Figure 1 Metabolomics study workflow.
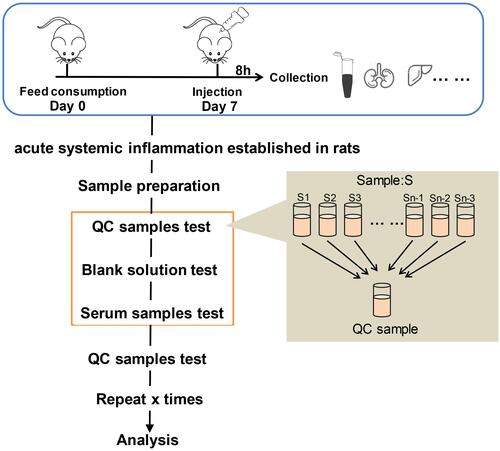
Figure 2 Effects of LPS on serum biochemical indicators: white blood cells (WBCs) (A), monocytes (B), neutrophils (C), lymphocytes (D) and red blood cells (RBCs) (E); serum levels of TNF-α (F) and IL-6 (G); serum levels of the oxidative stress factors superoxide dismutase (SOD) (H), malondialdehyde (MDA) (I), and catalase (CAT) (J); and kidney and liver function indicators: total bile acids (TBA) (K), creatine (Cr) (L), blood urea nitrogen (BUN) (M), aspartate transaminase (AST) (N) and alanine transaminase (ALT) (O).
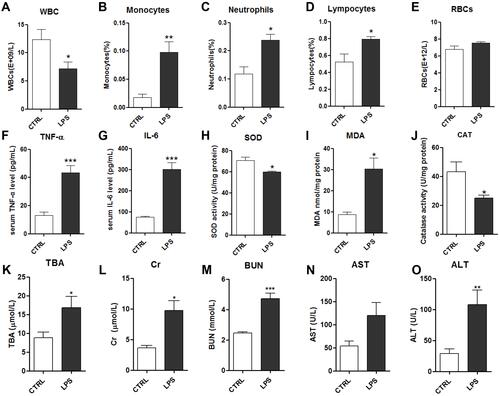
Figure 3 Histopathological analyses of tissues in the LPS and control groups. (A–F) Hematoxylin and eosin (H&E) staining of liver (400×), kidney (400×), lung (200×), colon (100×), hippocampus (200×), and cerebral cortex (200×) tissues in the LPS and control groups. (G–L) Terminal deoxynucleotidyl transferase dUTP nick end labeling (TUNEL) assays of liver, kidney, lung, colon, hippocampus, and cerebral cortex tissues (200×) in the LPS and control groups. The arrows point to the damage area.
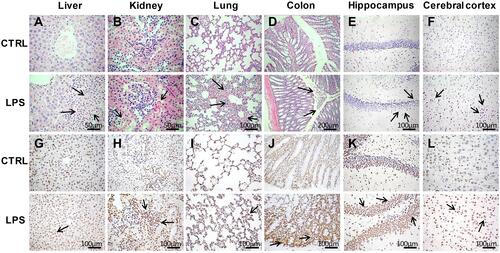
Figure 4 Representative total ion chromatograms (TICs) of serum samples subjected to (UPLC/QTOF-MS) in positive and negative ion modes. (A and B) TICs of CTRL group and LPS group in the positive ion modes; (C and D) TICs of CTRL group and LPS group in the negative ion modes.
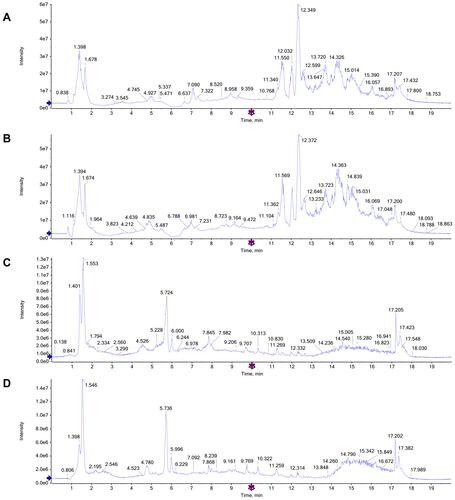
Figure 5 Metabolomics analysis of serum samples from rats in the LPS and control groups (n=10 per group) in the positive and negative ion modes. Partial least squares-discriminant analysis (PLS-DA) score plot in the (A) positive and (B) negative ion modes. Permutation test of PLS-DA model in the (C) positive and (D) negative ion modes.
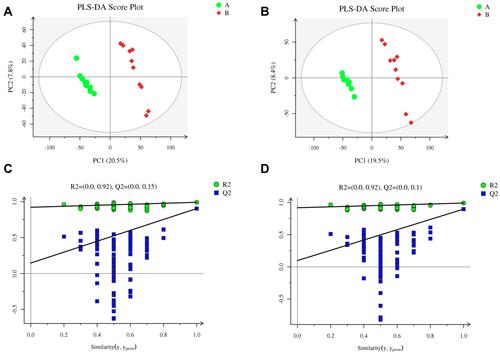
Table 1 Identification of Serum Endogenous Metabolites During LPS-Induced Acute Systemic Inflammation
Figure 6 Chord diagram of differential serum metabolites. Classification of the metabolites detected into major functional classes.
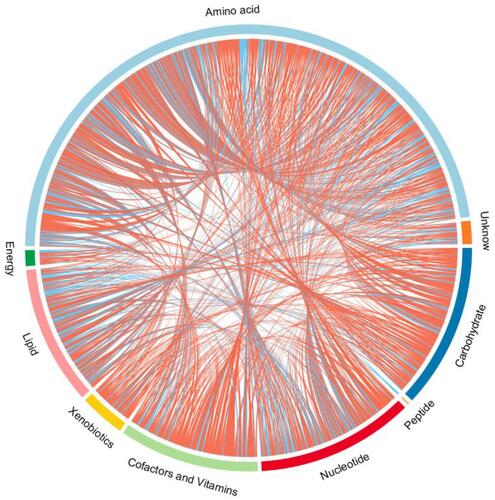
Figure 7 Pathway analysis. (A) Summary of pathway analysis. (a) Alanine, aspartate, and glutamate metabolism; (b) D-glutamine and D-glutamate metabolism; (c) linoleic acid metabolism; (d) arginine and proline metabolism; (e) butanoate metabolism; (f) glutathione metabolism; (g) taurine and hypotaurine metabolism; (h) pantothenate and coenzyme A (CoA) biosynthesis and (i) cysteine and methionine metabolism. Log (P) values from the pathway enrichment analysis are shown on the y-axis, and pathway impact values from the pathway topology analysis are shown on the x-axis. (B) Network diagram of metabolic pathway. The size represents the pathway impact value and the color represents the degree of pathway correlation (based on the number of connected nodes).
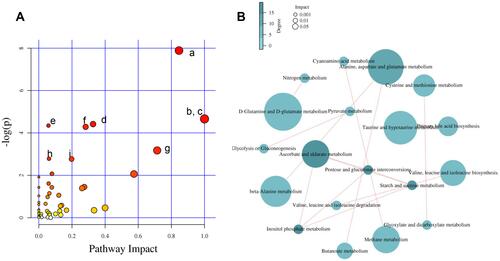
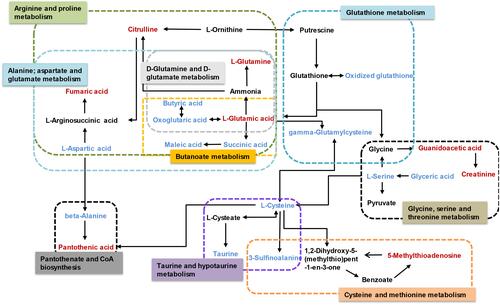
Figure 8 Schematic diagram of the disturbed metabolic pathways affected by LPS. Red indicates increased abundance and blue indicates decreased abundance in the LPS group compared to the control group.