Figures & data
Figure 1 MyD88 forms a functional complex with ER-α. (A) HEK293T cells were transfected with a plasmid encoding ER-α and/or Flag-MyD88 (WT), Flag-MyD88-LXXAA (LXXAA), Flag-MyD88-delta LXXLL (∆LXXLL), and Flag-MyD88-delta death domain (∆DD). Lysates were immunoprecipitated with anti-ER-α antibody and immunoblotted with anti-Flag antibody. The experiment was performed twice with similar results. (B) Luciferase activity from NF-κB luciferase in HEK293T cells overexpressing MyD88 WT, LXXAA, ∆LXXLL, or ∆DD. All luciferase values were normalized based on Renilla luminescence. (**), P<0.01. Data are representative of 3 independent experiments, and n=3 in each experiment (upper graph). IL-8 production by HEK293T cells was measured by ELISA in culture supernatants of HEK293T cells overexpressing MyD88 WT, LXXAA, ∆LXXLL, or ∆DD. (**), P<0.01. The experiment was performed at least three times with similar results, and n=3 in each experiment (lower graph). (C) Luciferase activity from NF-κB-luciferase reporter in MCF7 cells pretreated with cell-permeable peptides containing the LXXLL motif (WT) or a mutant form (mut), and stimulated with 10 ng/mL IL-1. The experiment was performed twice with similar results. (D) THP-1 monocytic cells were stimulated with 1 µg/mL LTA and/or 10 nM estrogen (E2), then stained for MyD88 and ER-α according to the Duolink protocol. Magnification: 40x. The experiment was performed twice with similar results.
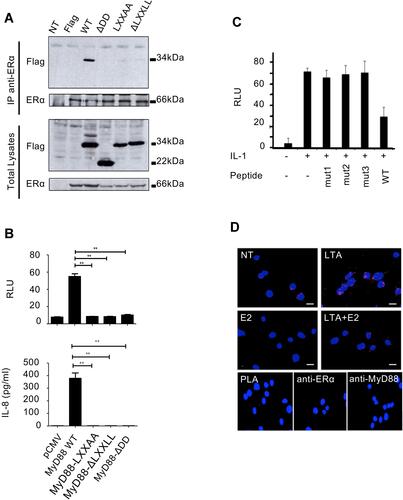
Figure 2 IL-1 stimulation leads to the formation of MyD88/methER-α complexes, which are required for NF-κB transcriptional activity and IL8 production. (A) MCF7 cells were transfected with control siRNA (siControl) or PRMT1-specific siRNA (siPRMT1) and then treated with 10 nM E2, 10 ng/mL IL-1, or both. Methylated ER-α was then immunoprecipitated and blotted with anti-MyD88 and anti-ER-α antibodies. (B) MCF7 cells were transfected with siControl or siPRMT1 and were treated with IL-1. Methylated ER-α was then immunoprecipitated and blotted for MyD88, ER-α, p85, and Src. (C–E) MCF7 cells were transfected with siControl or siPRMT1, and treated with IL-1. After 24h, IL-8 production was measured in culture supernatants by ELISA (C); the amount of p-p65 (Ser468), IKBα, PRMT1 and actin was determined by Western blot (D); and luciferase activity from an NF-κB-luciferase reporter was measured. Values were normalized based on Renilla luminescence (E). (F) MCF7 cells were pretreated with cell-permeable WT or mutant (mut) peptides for 1h and then stimulated with IL-1 for the indicated times. The amount of p-p65 (Ser468), IKBα, PRMT1, and actin was determined by Western blot. In this figure, blots have been cropped to improve clarity (white line). All these experiments were performed three times with similar results. P-values are indicated by (**) when P<0.01, and (***) when P<0.001.
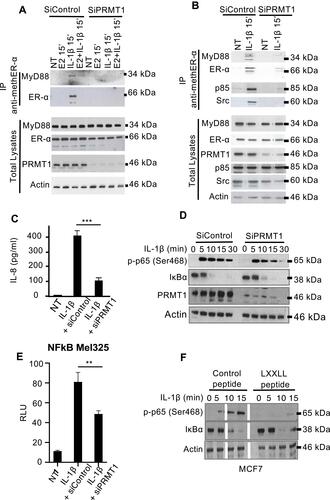
Table 1 MyD88-methER-α Interaction in Normal Human Tissue
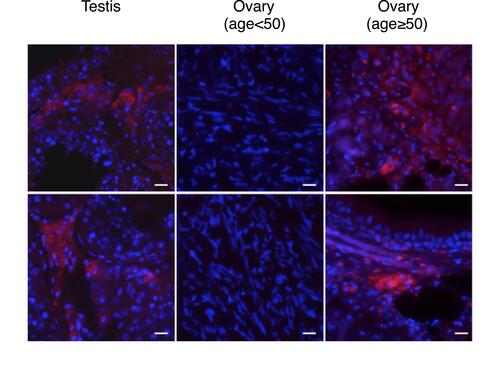
Figure 3 Segregation of MyD88/ER-α interaction according to gender. MyD88 and methERα interaction in human normal testis and ovary tissues revealed by proximity ligation assay (red dots). Magnification: 60x.