Figures & data
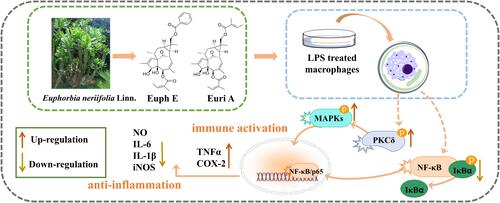
Figure 1 Structures of Euph E and Euri A isolated from Euphorbia neriifolia Linn.
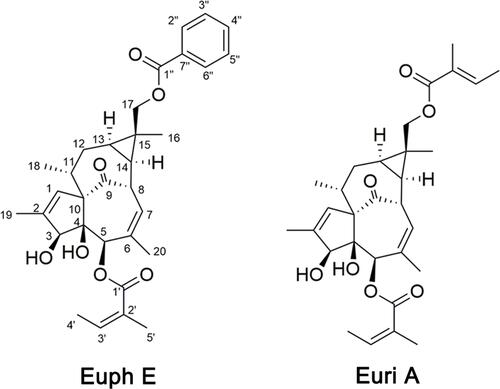
Table 1 1H-(600 MHz) and 13C-(150 MHz) NMR Data of Euph E in CDCl3 (δ in Ppm, J in Hz)
Figure 2 (A) Key HMBC correlations and (B) ROESY correlation of Euph E.
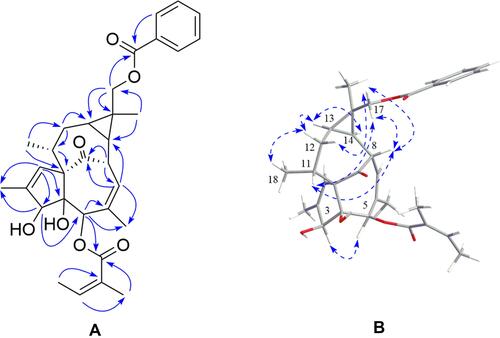
Figure 3 Effects of compounds on cell viability in RAW264.7 macrophages. Cells were treated with Euph E or Euri A (2.5-40 μM) and LPS (1 µg/mL) for 24 h; Cell viability was measured by MTT assay. Values are expressed as means ± SD of three independent experiments.
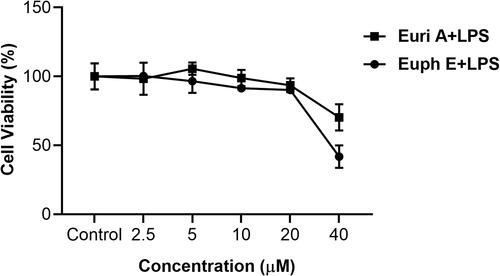
Figure 4 Euph E and Euri A inhibit NO production and iNOS expression. Cells were pretreated with Euph E or Euri A (2.5-20 μM) and then co-incubated with LPS (1 μg/mL). (A) NO production was determined by measuring the level of nitrite in culture medium. (B) The expression of iNOS protein was determined by Western blot analysis. Actin served as an internal control. The values represent the mean ± SD of three independent experiments (Supplementary Figure S7). Compared with control group, ###P<0.001; Compared with LPS group, *P<0.05, ***P<0.001.
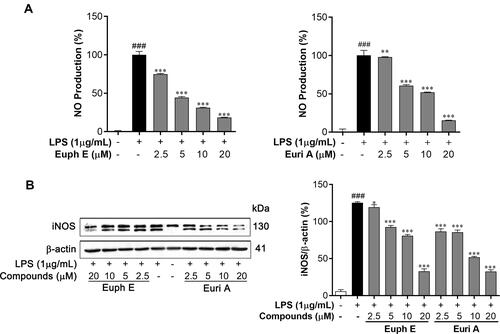
Figure 5 Euph E and Euri A reduced IL-1β and IL-6 secretion. Cells were pretreated with Euph E or Euri A (2.5-20 μM) and then co-incubated with LPS (1 μg/mL) for 24 h. The secretion of (A) IL-1β and (B) IL-6 in culture medium were determined using ELISA kits. The values represent the mean ± SD of three independent experiments. Compared with control group, ###P<0.001; Compared with LPS group, *P<0.05,**P<0.01, ***P<0.001.
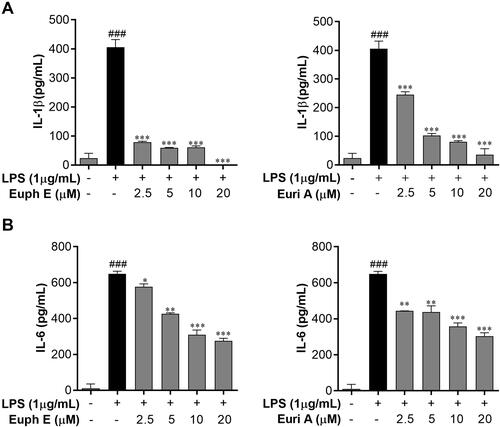
Figure 6 Effects of compounds on IκBα/NF-κB signaling pathway in macrophages. Cells were pretreated with Euph E or Euri A for 1 h, followed by co-incubated with LPS (1 μg/mL) for 30 min. (A) The protein levels of phospho-IκBα and IκBα were detected by Western blot analysi. Actin was probed as an internal control. The experiments were performed in triplicate (Supplementary Figure S7). Compared with control group, ###P<0.001; Compared with LPS group, ***P<0.001. (B) The nuclear translocation of NF-κB p65 was detected by immunofluorescence. Nuclei were stained with DAPI (blue). Scale bar=20 μm.
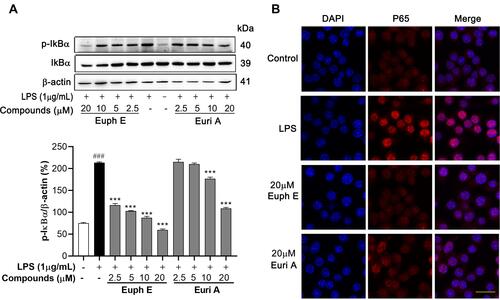
Figure 7 Euph E and Euri A promoted PGE2 and TNF-α secretion and COX-2 expression. Cells were pretreated with Euph E or Euri A (2.5-20 μM) for 1 h and then co-incubated with LPS (1 μg/mL). The production of (A) TNF-α and (B) PGE2 in culture medium were measured using ELISA kits. (C) The expression of COX-2 protein was determined by Western blot analysis. Values are expressed as means ± SD of the three independent experiments (Supplementary Figure S7). Compared with control group, ###P<0.001; Compared with LPS group, *P<0.05, **P<0.01, ***P<0.001.
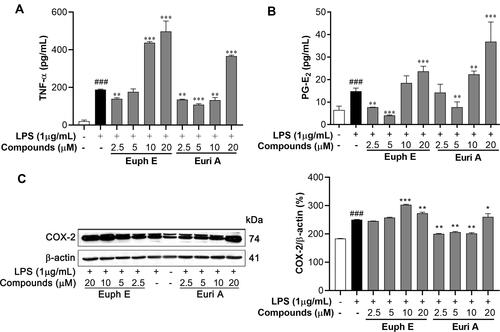
Figure 8 Euph E and Euri A promoted MAPK pathways activation. Cells were pretreated with compounds (2.5-20 μM) for 1 h, then were stimulated with LPS (1 μg/mL) for 30 min. Protein extracts were analyzed by Western blot analyses using (A) anti-phospho-p38MAPK, anti-p38MAPK, (B) anti-phospho-JNK, anti-JNK, (C) anti-phospho-ERK and anti-ERK antibodies against the activated MAPKs. Actin was assessed as a loading control. The data shown are representative of at least three independent experiments (Supplementary Figure S8). Compared with control group, ###P<0.001; Compared with LPS group, *P<0.05, **P<0.01, ***P<0.001.
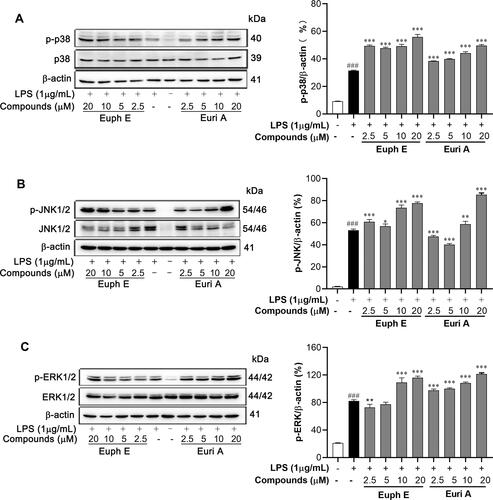
Figure 9 Euph E and Euri A promoted PKCδ activation in macrophages. Cells were co-incubated with LPS (1 μg/mL) for 30 min after pretreated with Euph E or Euri A for 1 h. Protein extracts were then analysed for PKC-δ phosphorylation by Western blotting. Actin was assessed as a loading control. The experiments were performed in triplicate (Supplementary Figure S9). Compared with LPS group, *P<0.05, ***P<0.001.
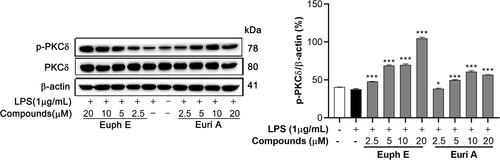
Figure 10 PKCδ inhibitors inhibited compounds inducing immune activation. Cells were preincubated with compounds (20 µM) in the absence or presence of PKCδ inhibitors (200 nM) for 1 h and stimulated with 1 μg/mL LPS for 30 min (for p-PKCδ, p-JNK and p-ERK) or 18 h (for COX-2). Actin was assessed as a loading control. Compared with control group, ###P<0.001; Compared with LPS group, *P<0.05, **P<0.01, ***P<0.001.
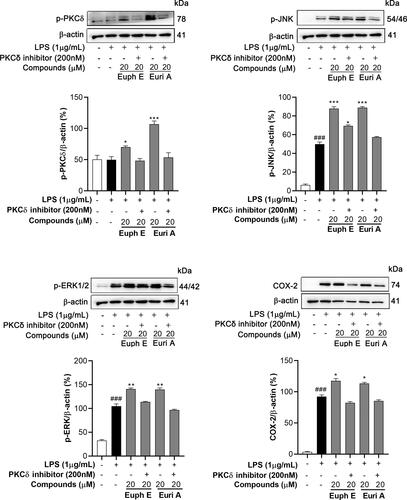
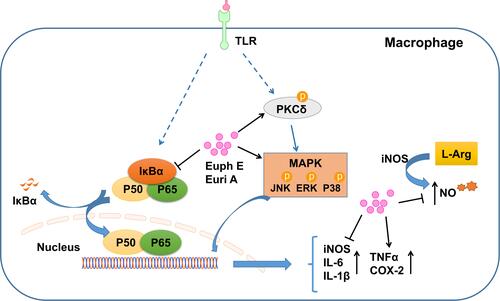
Figure 11 Schematic of Euph E and Euri A affecting the immnue function of macrophages.