Figures & data
Figure 1 MEF2D participated in the inflammatory response of BV2 cells. (A) LPS induced an increase in the level of MEF2D, which was mainly distributed in the nucleus in BV2 cells. BV2 cells were exposed to 500 ng/mL of LPS for 6, 12 or 24 h, and nuclear and cytoplasmic proteins were fractionated to quantify MEF2D by immunoblotting. (A right graph) The relative quantification of MEF2D is shown. (B) BV2 cells were transfected with recombinant lentivirus expressing either control shRNA, shRNA-MEF2D (shMEF2D), or overexpression-MEF2D (OE-MEF2D), and stable cell lines were selected followed by treatment with LPS for 12 h or IL-4 for 18 h. The protein levels of the proinflammatory factors NLRP3 and iNOS were tested by immunoblotting. (B right graphs) The relative quantification data are shown. Data in A and B from three independent experiments are expressed as the mean ± SEM and were analysed by two-way ANOVA (**P ≤ 0.01). (C) The morphological effects of MEF2D on BV2 cells were determined. BV2 cells stably expressing NC, shMEF2D, or OE-MEF2D were treated with LPS for 12 h, and the morphological changes were analysed by optical microscopy. Arrows indicate activated microglia. The scale bars represent 50 μm. (C bottom graph) Active cells were defined as those with a ratio of long axis to short axis greater than 1.5. (D) The effect of MEF2D on phagocytosis was determined in BV2 cells. Fluorescent beads were added to the cells for 4 h. Immunofluorescence staining was performed to measure phagocytosis capacity. Arrows indicate microglia undergoing phagocytosis. Scale bars represent 50 μm. (D right chat) The ratio of red fluorescent positive cells reflects the phagocytic activity of microglia. The data shown in C and D are from at least 300 cells of 5 vision fields in three independent experiments, and analysed by two-way ANOVA (*P ≤ 0.05, **P ≤ 0.01).
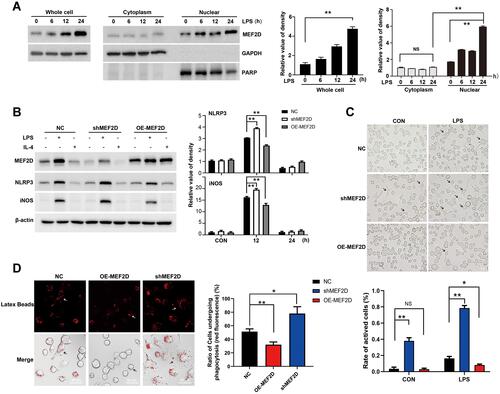
Figure 2 MEF2D knockdown hyperactivates BV2 cells. BV2 stable NC and shMEF2D cell lines were treated with LPS. (A and B) The mRNA and protein levels of the preinflammatory factor NLRP3 were tested by qPCR and Western blot. (B bottom graph) Relative quantification data are shown. (C) The effect of shMEF2D on the secretion of the preinflammatory cytokine IL-1β following LPS treatment was determined. The secreted levels of IL-1β were tested by ELISA. (D and E) The mRNA and protein levels of the preinflammatory factor iNOS and the oxidative stress regulator Nrf2 were tested by qPCR and immunoblotting, respectively. (E bottom graph) Relative quantification data are shown. The data from three independent experiments are expressed as the mean ± SEM and were analysed by two-way ANOVA (*P ≤ 0.05, **P ≤ 0.01).
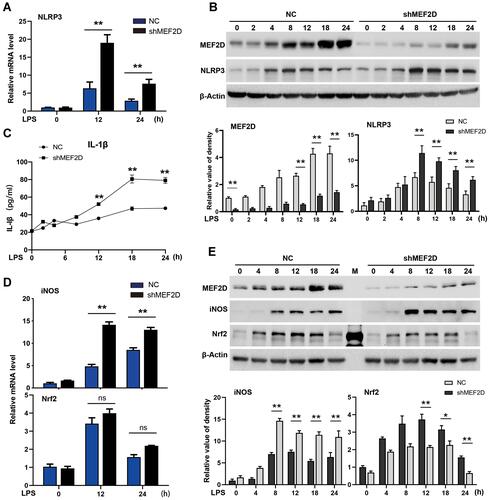
Figure 3 Functional annotation and canonical pathways of MEF2D knockdown in BV2 cells. (A and B) The knockdown efficiency of shRNA-MEF2D was tested by Western blot and luciferase reporter assays. The data from three independent experiments are expressed as the mean ± SEM and were analysed by two-way ANOVA (*P ≤ 0.05, **P ≤ 0.01). (C) The first principal component (PC1) separates the NC, NC + LPS, shMEF2D and LPS + shMEF2D samples, while the second principal component (PC2) separates the biological replicates of the same population in BV2 cells. (D) A heat map representing RNA-Seq shared differentially expressed genes between shMEF2D and NC cells stimulated with LPS is shown. Heat maps were generated with Multi Experiment Viewer (version 4.8) software. (E) The number of differentially expressed genes between different groups was determined. (P ≤ 0.01, and log2-fold change ≥1.5). (F) Gene ontology analysis of the functional annotations of differentially expressed genes of MEF2D knockdown compared to NC with (right) or without (left) LPS treatment in BV2 cells is shown. (P ≤ 0.01, and log2-fold change ≥1.5).
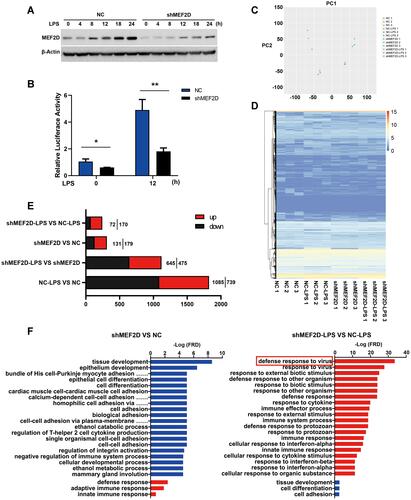
Figure 4 MEF2D knockdown significantly inhibited the interferon signalling pathway. (A) A heat map representation of the interferon-stimulated genes differentially expressed between shMEF2D and NC BV2 cells stimulated with LPS is shown. Data are from three independent experiments (P ≤ 0.01, and log2-fold change ≥ 1.5). Heat maps were generated with Multi Experiment Viewer (version 4.8) software. (B) The network of significantly differentially expressed genes was evaluated by RNA-seq in BV2 shMEF2D and NC stable cell lines with LPS treatment (P ≤ 0.01, and log2-fold change ≥ 1.5). (C and D) Transcript abundance (in read count) was evaluated using RNA-seq in the key regulators (IRF7 and IRF3) (C) and effectors (IL-6, IL12B and CXCL10) (D) of the type I interferon signalling pathway in different LPS-treated BV2 stable cell lines. The data from three independent experiments are expressed as the mean ± SEM and were analysed by two-way ANOVA (**P ≤ 0.01).
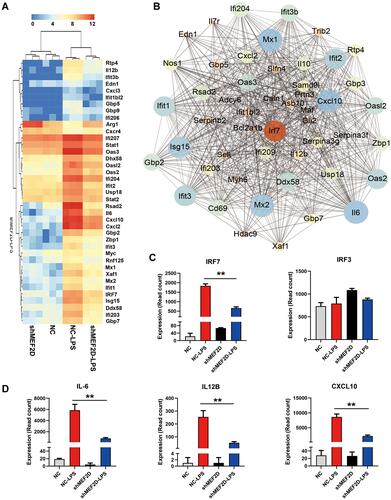
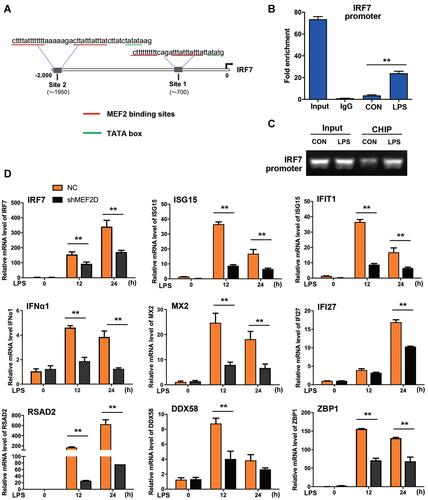
Figure 5 Regulation of the interferon signalling pathway by MEF2D. (A) MEF2 binding sites in the IRF7 promoter were identified. The underlined sequences in red indicate the MEF2 binding site, and those in blue indicate the auxiliary sequence TATA box. (B and C) Binding of MEF2D to the IRF7 promoter was assessed in BV2 cells. BV2 cells treated with LPS for 12 h were analysed by ChIP-qPCR and PCR. (D) MEF2D knockdown significantly reduced the key ISG levels. BV2 NC and shMEF2D stable cell lines were stimulated by LPS, and the mRNA levels of IRF7 and several ISGs, the key inducible factors of the interferon signalling pathway, were quantified by qPCR. The data from three independent experiments are expressed as the mean ± SEM and were analysed by two-way ANOVA (**P ≤ 0.01).