Figures & data
Figure 1 Example of a DVT-HU measurement of a BMDJ following clinical evaluation. The HU attenuation coefficients are shown as a curve over the measured section. In the present validation study, only the mean values (MV) are used.
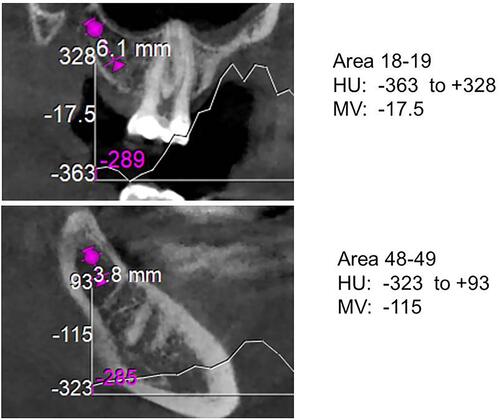
Figure 2 Comparison of R/C expression and cytokine pattern in degenerative (tumors) and systemic inflammatory diseases (CFS).
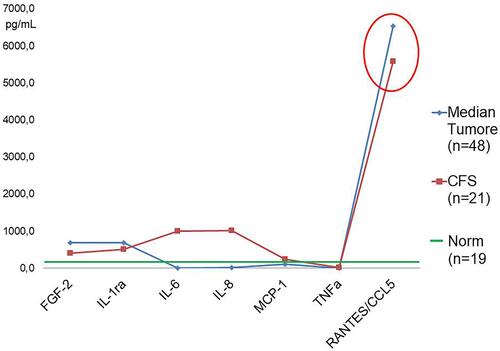
Figure 3 Typical samples of BMDJ/FDOJ with complete dissolution of the bone trabecula. Below the sample, the head of a ceramic drill with a 2 mm diameter is shown to provide a size comparison.
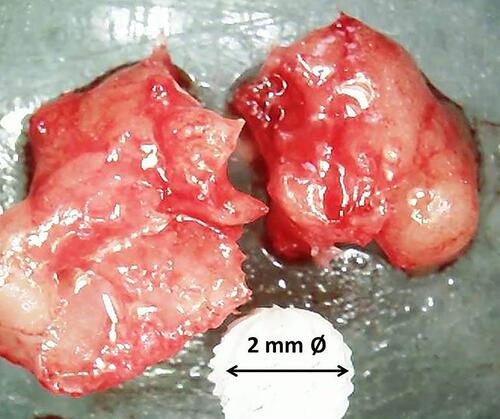
Table 1 Statistical Analysis Results of the DVT-HU Values in Each Group
Table 2 Statistical Analysis Results of the R/C Expression Levels in Each Group
Table 3 This Table Shows the Mean Values of DVT-HU and R/C Expression for Focal BMDJ/FDOJ for Each Chronic Disease Group
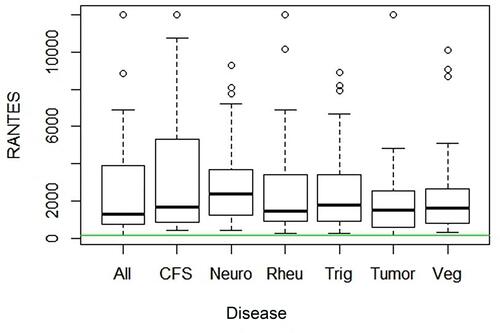
Figure 4 A significant reduction in HU values was observed in BMD areas, with measured values falling well below the minimum value for healthy cancellous bone (ie, 300), as represented by the green line.
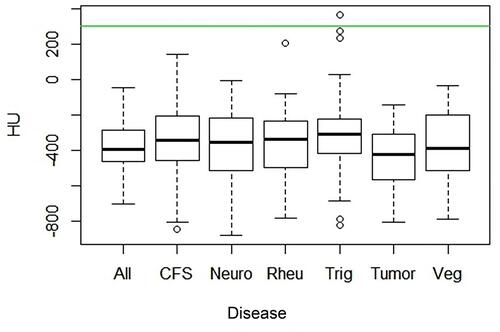
Figure 5 R/C signaling is overexpressed for all chronic disease groups compared to the common value of 149,9 pg/mL for healthy cancellous jawbone (shown by the green line).