Figures & data
Table 1 Comparison of Laboratory Indexes in Patients with Acute Gout, Intercritical Gout and Healthy Controls
Figure 1 miR-223 was required for macrophage homeostasis, but not development and phagocytosis. (A) The cells harvested from peritoneal cavity with 2 mL PBS were stained with anti-F4/80 and anti-CD11b antibodies and analyzed by flow cytometry. (B) The bone marrow cells were cultured and induced by Dulbecco’s modified Eagle’s medium (DMEM) with 30 ng/mL macrophage colony-stimulating factor for 7 days. The DMEM was refreshed every 2 days until the cells were harvested and the purity of the bone marrow-derived macrophages (BMDMs) were then identified with flow cytometry. The BMDMs were represented by positive F4/80 and CD11b. (C) Monosodium urate (MSU) crystal phagocytosis was analyzed by flow cytometry in BMDMs from miR-223 KO and WT mice at different time points after MSU crystal challenge in vitro. n=3–5 for each group and unpaired t-test was used for each group at indicated time points. The results are representative of 3 independent experiments. n=3–5 for each group. **P<0.01.
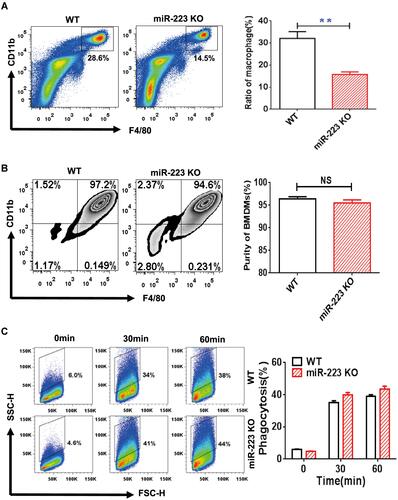
Table 2 Sequences of Human and Murine Genes Primers Used in Our Study
Figure 2 miR-223 was validated both in miR-223 knock-out (KO) and wild-type (WT) mice and changed in bone marrow-derived macrophages (BMDMs) from WT mice treated with monosodium urate (MSU) crystals in vitro. (A) Relative expression of miR-223 was measured by TaqMan-PCR in BMDMs and in large peritoneal macrophages (LPMs) from WT and miR-223 KO mice. (B) Relative expression of miR-223 was measured by TaqMan-PCR in BMDMs from WT mice treated with MSU crystals (100 μg/mL) for different time-points up to 24 h. Point 0 represented treatment without MSU crystals. The results are representative of 3 independent experiments. n=3–5 for each group, and the unpaired t-test was used for each group, and the Bonferroni post-test was used for the comparison between baseline and MSU crystals. Compared to the untreated group. **P<0.01, ***P<0.001.
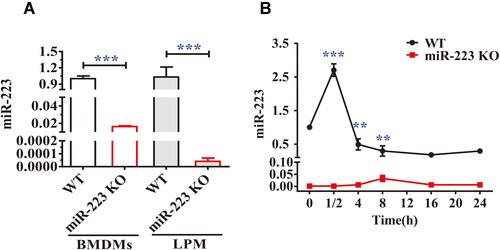
Figure 3 miR-223 deficiency exacerbated acute arthritis in response to monosodium urate (MSU) crystals. (A) 1 mg/40 μL MSU suspension was injected into the right foot pad of wild-type (WT) and miR-223 knock-out (KO) mice, and thickness of the foot pad was determined at 0, 6, 24 and 48 h after MSU administration. (B) 0.5 mg/20 μL MSU crystals were injected into the left ankle joints, and the ankles were measured at 0, 6, 24 and 48 h after MSU administration; swelling was expressed as a ratio > 0.15 which indicated inflammation. (C) The ankle joints were harvested 12 h after MSU treatment in 4% formalin and then tissue slices were prepared and stained with hematoxylin and eosin (H&E). Data are expressed as mean ± SEM. The results are representative of 3 independent experiments. n=6–8 for each group and the unpaired t-test was used for each group at the indicated time points. *P<0.05, **P<0.01.
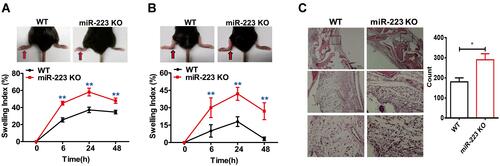
Figure 4 miR-223 deficiency enhanced monosodium urate (MSU)-induced inflammatory cell infiltration and cytokine secretion in the air pouch model. (A) Total cell numbers were counted using a hematocytometer. (B) Neutrophils and macrophages were gated by Fluorescence-Activated Cell Sorting (FACS). (C–F) Infiltrated neutrophils (C, D) and macrophages (E, F) were analyzed using FlowJo software. Infiltrated macrophages were represented by F4/80+, while neutrophils were represented by Ly6G+. (G–I) The protein levels of IL-1β (G), IL-6 (H) and MCP-1 (I) in air pouch lavage fluid harvested at 3, 6, 12 and 24 h were measured using ELISA. n=4–6 for each group and the unpaired t-test was used for each group at the indicated time points. *P<0.05, **P<0.01.
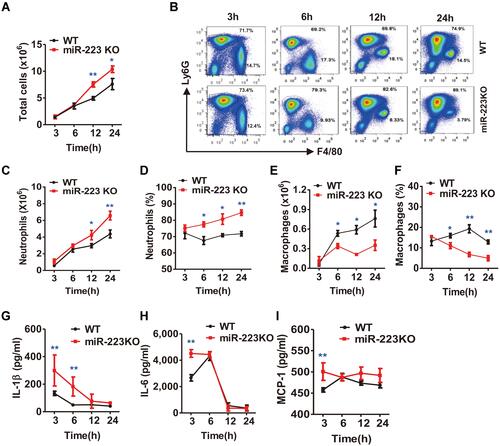
Figure 5 miR-223 deficiency aggravated neutrophil infiltration and pro-inflammatory cytokine secretion in monosodium urate (MSU)-induced peritonitis. (A) 3 mg/0.5 mL MSU suspension was injected into the peritoneal cavity, the lavage fluid was harvested at different time points. (A) Total cell numbers were counted using a hematocytometer. (B–F) Neutrophils and macrophages were analyzed by FACS. Macrophages were represented by F4/80+, while neutrophils were represented by Ly6G+. (G–I) IL-1β, IL-6 and MCP-1 levels in peritoneal cavity lavage fluid at the indicated time points were detected using ELISA. The results are representative of 3 independent experiments. n=4–6 for each group and the unpaired t-test was used for each group at the indicated time points. *P<0.05, **P<0.01.
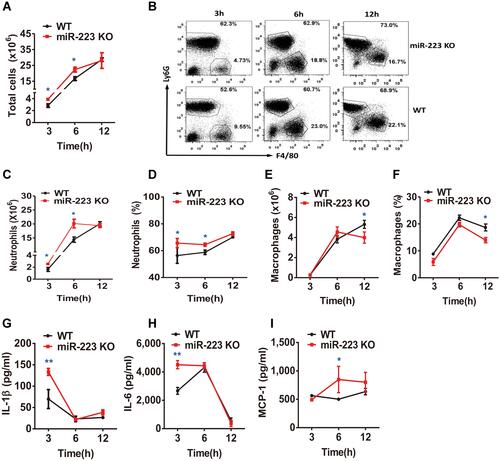
Figure 6 miR-223 deficiency promoted the monosodium urate (MSU)-induced inflammatory response by targeting NLRP3. (A) Relative expression of TNF-α mRNA in bone marrow-derived macrophages (BMDMs) treated with MSU (100 μg/mL) at 0, 4 or 8 hours was detected by real-time qPCR. (B and C) BMDMs from WT and miR-223 KO mice were incubated with MSU crystals (100 μg/mL) for 0, 2, 4 or 8h and brefeldin A (1:1000) was added to block cytokine secretion 1 h after MSU crystals administration. The BMDMs were represented by F4/80+CD11b+. (B) TNF-α was detected by FACS. (C) The ratio of BMDMs producing TNF-α was compared between miR-223 KO and WT mice. (D and E) Relative expression of NLRP3 (D) and IL-1β (E) mRNA in BMDMs treated with MSU (100 μg/mL) at 0, 4 or 8 h were detected by real-time qPCR. (F) The protein levels of NLRP3 and IL-1β p31 in the BMDMs from miR-223 KO and WT mice treated with MSU at 0, 2, 4 or 8 h were detected by Western blot and were analyzed using Image J software. The results are representative of 3 independent experiments. n=3–5 for each group, and the unpaired t-test was used for each group at the indicated time points. *P<0.05, **P<0.01, ***P<0.001.
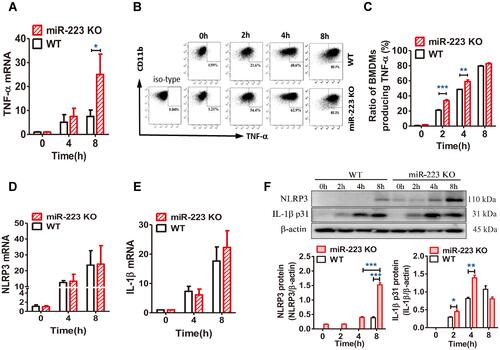
Figure 7 miR-223 level was down-regulated in peripheral blood mononuclear cells (PBMCs) from patients with gout. (A) miR-223 level was measured in PBMCs from patients with acute gout (AG, n=80), intercritical gout (IG, n=40) and healthy controls (HC, n=40). (B–D) The PBMCs from HC treated with MSU crystals (100 μg/mL) for 12 h in vitro were harvested for measurement of miR-223 (B), NLRP3 mRNA (C) and IL-1β protein (D) in the supernatant. The miRNA or mRNA level was detected by real-time qPCR, and the protein level was measured using ELISA. The results are representative of 3 independent experiments. n=3 for each group (B–D). One-way analysis of variance or the paired t-test, and the Bonferroni post-test were used for comparisons between the groups. **P<0.01. ***P<0.001.
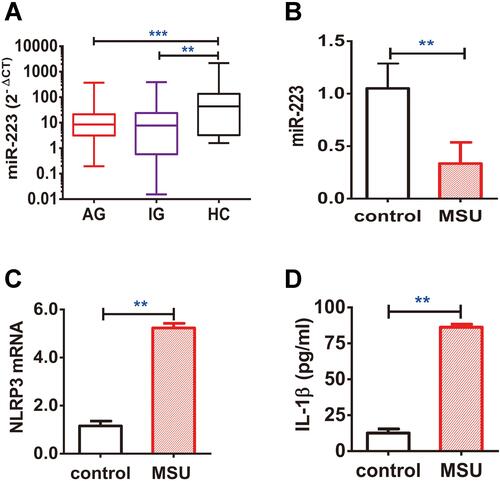
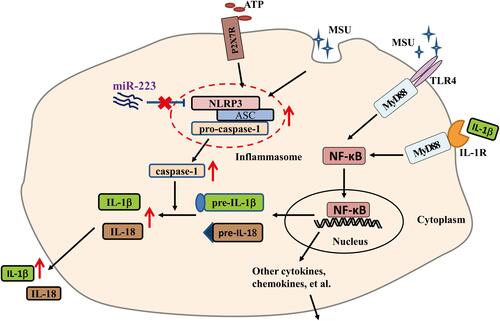
Figure 8 The schematic diagram shows that miR-223 deficiency exacerbates acute inflammatory response to monosodium urate crystals by targeting NLRP3.