Figures & data
Figure 1 The timeline of experiment. The nylon monofilament was removed after 2 h of ischemia. (A) Schematic representation of part 1 experiment about the effect of CYLD gene interference on microglial polarization after 72h reperfusion. (B) Schematic representation of part 2 experiment. The rats were initially treated with EA when the nylon monofilament was withdrawn and then once daily until sacrifice. The effect of EA on neuroinflammatory injury was explored at 72 h reperfusion. (C) The expression of CYLD mRNA before inducing MCAO/R model was clearly enhanced/decreased via lentivirus administration. The rats were randomly divided into four groups: Normal, LV-CYLD, LV-shCYLD and LV-control group. **p<0.01 and #p<0.05 vs Normal group.
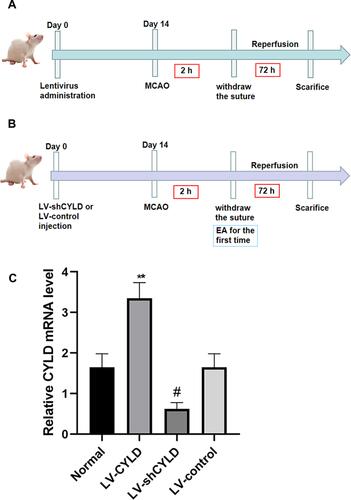
Figure 2 CYLD regulates microglial polarization after 72 h of reperfusion in ischemic stroke rats. (A) The coronal brain section stained with TTC is labeled with a box to show the periischemic cortex analyzed. (B) Schematic representation of the Baihui (GV 20) acupoint ((A) intersection of the sagittal midline and the line between the ears), the Hegu (LI 4) acupoint ((B) the radial side of the left second metacarpal midpoint) and the Taichong (LR 3) acupoint ((C) the dent between the first and second left metatarsal) were selected according to Experimental Animals Meridians Mapping. The mRNA level of M1 microglia related pro-inflammatory genes ((C), n=5) and M2 microglia related anti-inflammatory genes ((D), n=5) were measured with RT-qPCR at 72 h reperfusion in the border region of the ischemic cortex. The graph shows the relative mRNA levels after normalization to the housekeeping gene β-actin. All values are presented as the means ± SEMs. @@p<0.01, @p<0.05, $p<0.05, $$p<0.01 and $$$p<0.001 vs the MCAO/R group.
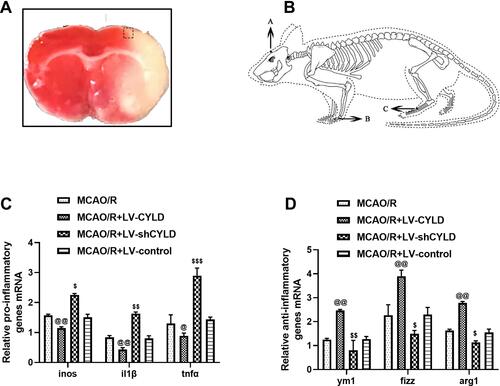
Table 1 The Longa Score for Neurological Scores
Table 2 The Bederson Score for Neurological Scores
Table 3 The Garcia Score for Neurological Scores
Table 4 List of Primers Used for RT-qPCR
Figure 3 CYLD inhibits the NLRP3 inflammasome and microglial activation after 72 h reperfusion in rats. (A) NLRP3 mRNA expression were measured with RT-qPCR at 72 h reperfusion in the periischemic cortex (n=5). The graph shows the relative mRNA levels after normalization to the housekeeping gene β-actin. (B) NLRP3+/Iba+ cell counts were expressed as number/mm2. (C) Immunofluorescence staining showed co-expression of NLRP3 (red) and microglia (green, Iba 1) in the periischemic cortex (White arrows indicate co-expression between NLRP3 and microglia, scale bar = 50 µm, n=5). All values are presented as the means ± SEMs. **p<0.01, ##p<0.01,$p<0.05 and @@p<0.01 vs the MCAO/R group.
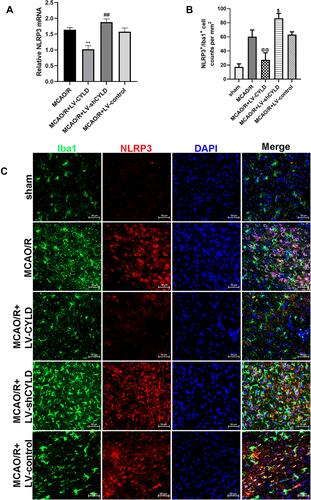
Figure 4 CYLD silencing partially weakens the neuroprotective effects of EA after 72 h reperfusion in ischemic stroke rats. (A) Images of cerebral infarction stained with 2% TTC (white, infarct tissue; red, non-infarct tissue) at 72 h reperfusion. (B) Infarct volumes are percent of intact hemispheres at 72 h reperfusion (n=3). (C) Longa score for neurological evaluation at 72 h reperfusion (n=5). (D) Bederson score for neurological evaluation at 72 h reperfusion (n=5). (E) Garcia score for neurological evaluation at 72 h reperfusion (n=5). All values are presented as the means ± SEMs. ##p<0.01, @p<0.05,**p<0.01, &p<0.05, ***p<0.001, &&p<0.01, ###p<0.001 and $$p<0.01 vs the MCAO/R+EA group.
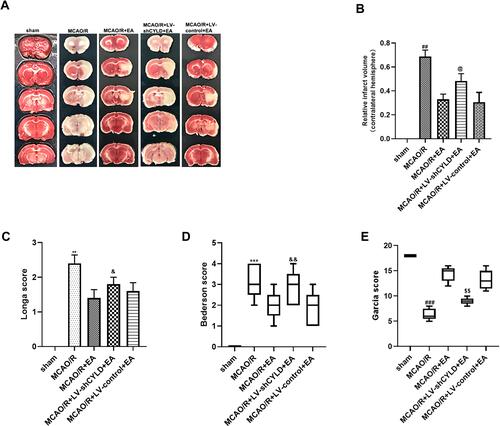
Figure 5 CYLD silencing partially weakens EA-mediated improvement of M2 microglial phenotype in the periischemic cortex. (A) Immunofluorescence staining showed co-expression of CD206 (red) and microglia (green, Iba 1) in the periischemic cortex (n=5, white arrows indicate M2 (➤). Scale bar = 50 µm). (B) Anti-inflammatory genes ((B), n=6) mRNA expression were measured with RT-qPCR at 72 h reperfusion in the periischemic cortex. The graph shows the relative mRNA levels after normalization to the housekeeping gene β-actin. (C) CD206+/Iba+ cell counts were expressed as number/mm2. All values are presented as the means ± SEMs. @@p<0.01 and @@@p<0.001 vs the MCAO/R group. ##p<0.01 and $p<0.05 vs the MCAO/R +EA group.
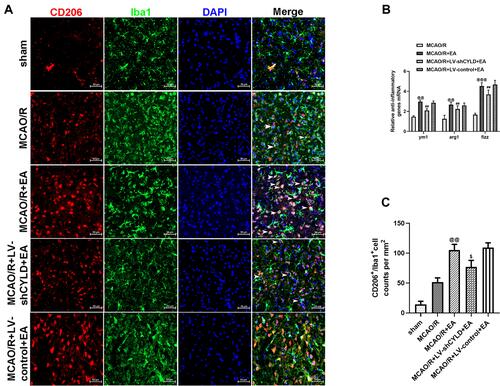
Figure 6 CYLD silencing partially weakens EA-mediated inhibition of M1 microglial phenotype in the periischemic areas. (A) Immunofluorescence staining showed co-expression of iNOS (red) and microglia (green, Iba 1) in the periischemic cortex (n=5, white arrows indicate M1 (➤) microglia. Scale bar = 50 µm). (B) Pro-inflammatory genes mRNA expression were measured with RT-qPCR at 72 h reperfusion in the periischemic cortex. The graph shows the relative mRNA levels after normalization to the housekeeping gene β-actin. (C) iNOS+/Iba+cell counts were expressed as number/mm2. All values are presented as the means ± SEMs. ##p<0.01 and ###p<0.001 vs the MCAO/R group. &p<0.05 and *p<0.05 vs the MCAO/R +EA group.
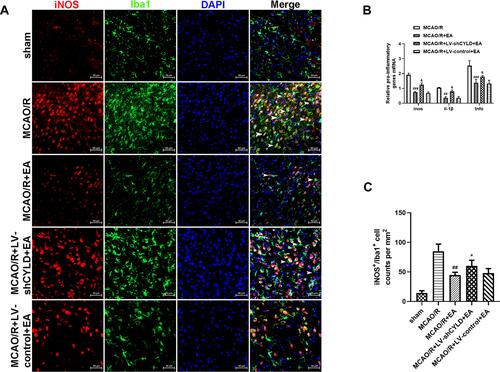
Figure 7 CYLD silencing partially weakens EA-mediated modulation of the CX3CL1/CX3CR1 axis and NLRP3 activation after 72 h reperfusion. (A) CX3CL1+/CX3CR1+ cell counts were expressed as number/mm2 (n=3). (B) Western blot of NLRP3, CX3CL1 and CX3CR1 protein expression. (C) NLRP3 and CX3CL1 proteins normalized with β-actin. CX3CR1 protein normalized with GAPDH (n=5). All values are presented as the means ± SEMs. @@p<0.01, **p<0.01 and *p<0.05 vs the MCAO/R+EA group. $$$p<0.001, ###p<0.001 and ##p<0.01 vs the MCAO/R group.
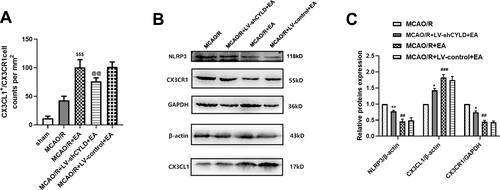
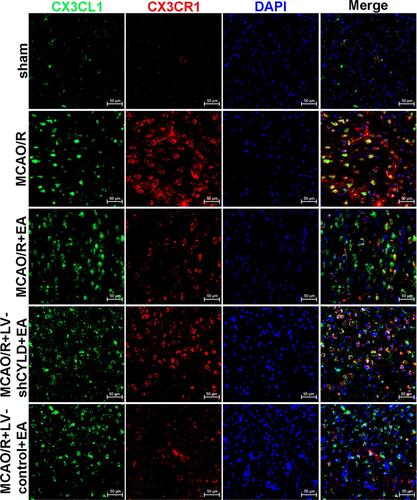
Figure 8 Co-expression of CX3CL1 (red) and CX3CR1 (green) in the periischemic cortex (n=5. Scale bar = 50 µm).