Figures & data
Figure 1 Exosomes from IL-1β-induced MSCs reduce urethral stricture in rabbits. (A) Schematic showing the design of animal experiments. (B) Transmission electron micrograph of vesicles isolated from MSCs (phosphotungstic acid negative staining). (C) Particle diameter distribution from nanoparticle tracking analysis of vesicles isolated from MSCs. (D) Western blot analysis of the exosomal markers TSG101 and CD63 in vehicles isolated from MSCs and vesicle‐free supernatant. (E) Typical retrograde urethrography images of rabbits treated with saline (control), TGF-β1 alone, TGF-β1 + Exo-MSCs, or TGF-β1 + Exo-MSCsIL−1β. (F) Diameters of urethras from rabbits treated as described for (E). (G) Representative images of Masson staining of collagen fibrosis in urethral tissue sections from rabbits treated as described for (E). (H) Quantification of fibrotic area of urethral tissue from rabbits treated as described for (E). Data in (F and G) are presented as the mean ± SD of n = 6 rabbits/group. Statistical analyses were performed with a t-test or t-test with Welch’s correction (*P < 0.05).
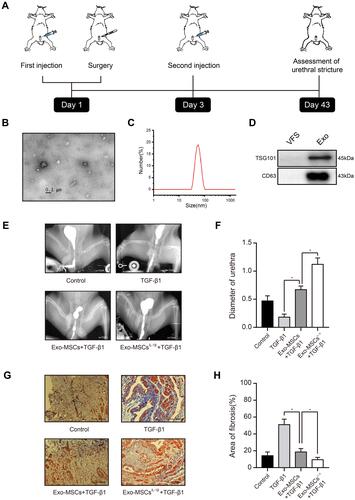
Figure 2 Exosomes from IL-1β-induced MSCs inhibit activation of urethral fibroblasts by regulating macrophage polarization in vitro. (A) Immunofluorescence microscopy images of Arg-1 expression in urethral tissues treated with TGF-β1 alone or TGF-β1 + Exo-MSCsIL−1β. (B) Light microscopy images showing the morphology of THP-1 cells incubated for 48 h with PMA in the presence or absence of Exo-MSCsIL−1β. (C) Schematic of the Transwell co-culture system used in this study. (D) qRT-PCR analysis of mRNA levels of the indicated macrophage markers in UFBs co-cultured with the indicated cells and/or factors. (E and F) Western blot analysis (E) and quantification of band densities (F) of the indicated macrophage markers in UFBs co-cultured with the indicated cells and/or factors. (G) Immunofluorescence microscopy images of α-SMA expression in UFBs co-cultured with the indicated cells and/or factors. (H and I) Western blot analysis (H) and quantification of band densities (I) of α-SMA, collagen I, and collagen III in UFBs co-cultured with the indicated cells and/or factors. Data in (D, F and I) are presented as the mean ± SD of at least three independent experiments and were analyzed with Student’s t-test or one-way ANOVA (*P < 0.05; ns, not significant).
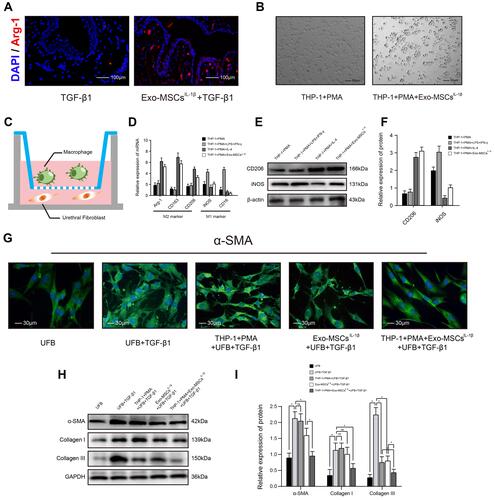
Figure 3 miRNA let-7c is enriched in exosomes isolated from IL-1β-induced MSCs and inhibits myofibroblast formation by promoting macrophage M2 polarization. (A–C) qRT-PCR analysis of let-7c expression in (A) MSCs incubated with or without IL-1β for XX h; (B) Exo-MSCs or Exo-MSCsIL−1β; and (C) THP-1 cells treated with saline + PMA, Exo-MSCs + PMA, or Exo-MSCsIL−1β + PMA for 48 h. (D) Epifluorescence images of uptake of PKH-67-labeled exosomes (green) taken up by PMA-treated THP-1 cells. Nuclei were stained with Hoechst 33342 (blue). (E) Light microscopy images showing THP-1 cells incubated with the indicated factors. (F) qRT-PCR analysis of mRNA expression levels of the indicated macrophage markers after incubation of THP-1 cells with the indicated factors. (G and H) Western blot analysis (G) and quantification of band densities (H) of CD206 after incubation of THP-1 cells with the indicated factors. (I) Immunofluorescence images of α-SMA expression in UFBs after incubation with the indicated cells and factors. (J and K) Western blot analysis (J) and quantification of band densities (K) of α-SMA, collagen I, and collagen III in UFBs treated as described for (I). Data in (A–C, F, H, and K) are presented as the mean ± SD of at least three independent experiments and were analyzed with Student’s t-test or one-way ANOVA (*P < 0.05).
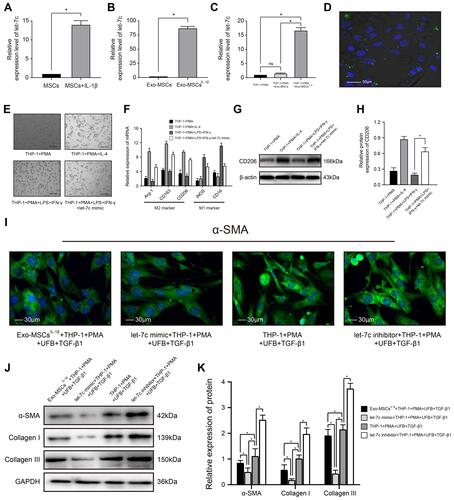
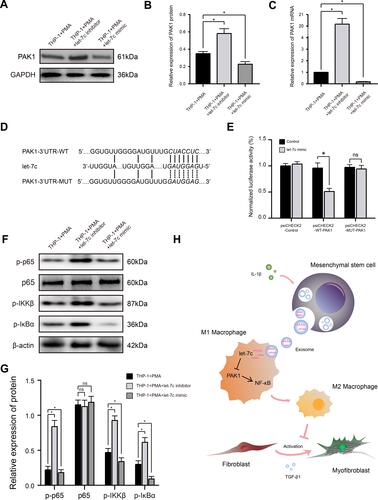
Figure 4 miRNA let-7c promotes macrophage M2 polarization by inhibiting the PAK1-dependent NF-κB signaling pathway. (A and B) Western blot analysis (A) and quantification of band densities (B) of PAK1 expression in PMA-treated THP-1 cells transfected with control, let-7c inhibitor, or let-7c mimic. (C) qRT-PCR analysis of PAK1 mRNA expression level in PMA-treated THP-1 cells transfected as described in (A). (D) Putative let-7c-binding sites in the PAK1-3′UTR-WT sequence, and the location of mutated residues in PAK1-3′UTR-MUT. (E) Relative luciferase activity in THP-1 cells co-transfected with a let-7c mimic and either empty vector, PAK1-3′UTR-WT, or PAK1-3′UTR-MUT vectors. (F and G) Western blot analysis (F) and quantification of band densities (G) of the indicated phosphorylated (p) markers of the NF-κB signaling pathway in PMA-treated THP-1 cells transfected as described for (A). (H) Proposed model based on the results of this study. Data in (B, C, E, and G) are presented as the mean ± SD of at least three independent experiments and were analyzed with Student’s t-test or one-way ANOVA (*P < 0.05; ns, not significant).