Figures & data
Table 1 The Results of ELISA Between Sham, AS and EMPA Group
Figure 1 Empagliflozin attenuated atherosclerotic lesion areas. Representative HE staining (A), Movat staining (B), CD68 immunohistochemistry (C) ang MCP-1 immunohistochemistry (D) of Sham, AS and EMPA group. #p<0.05, ##p<0.01.
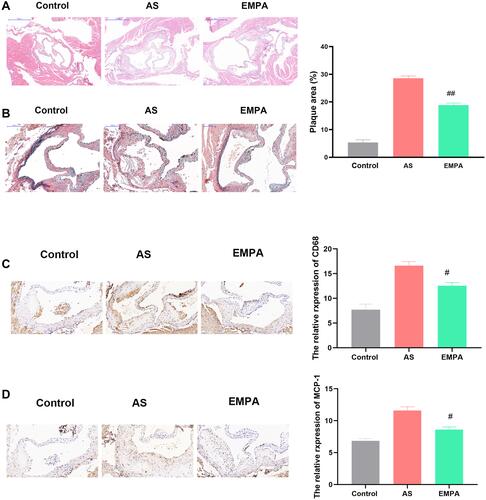
Figure 2 The serum level of triglyceride (A), total cholesterol (B), LDL (C) and HDL (D) between Sham, AS and EMPA group. ##p<0.01.
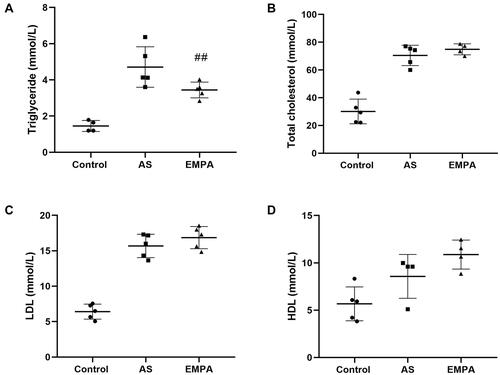
Figure 3 The serum level of IL-1β (A), IL-6 (B), and IL-10 (C) between Sham, AS and EMPA group. ###p<0.001.
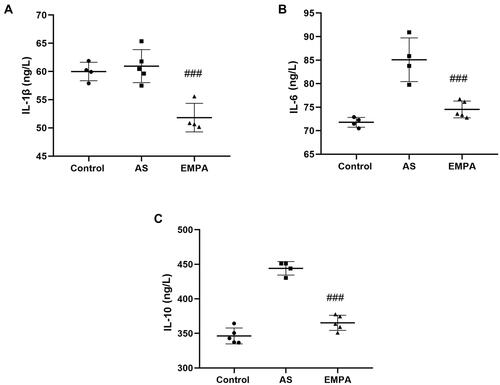
Figure 4 The serum level of renin (A), angiotensin II (B) and aldosterone (C) between groups. ##p<0.01 and ###p<0.001.
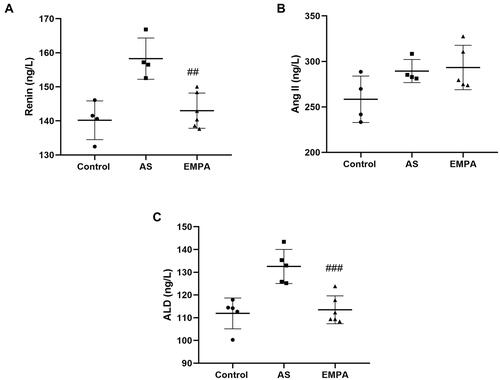
Figure 5 The serum level of norepinephrine (A) and neuropeptide Y (B) and body weight (C) and glucose (D) between Sham, AS and EMPA group. ##p<0.01 and ###p<0.001.
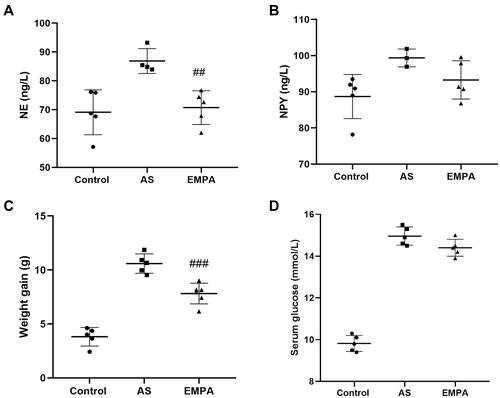
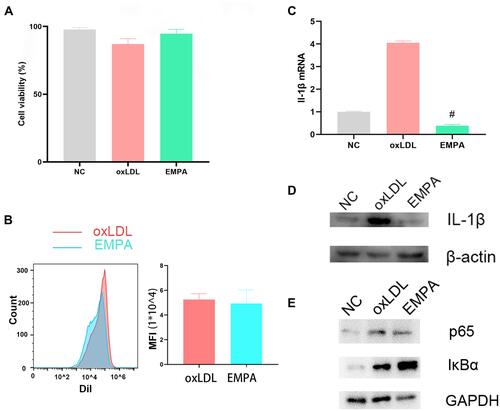
Figure 6 The cell viability of each group was examined by MTT assay (A). Qualitative (B; Left) and quantitative (B; Right) intensity of Dil-labeled oxLDL taken by macrophages between groups was examined by flow cytometry. The expression of IL-1β mRNA (C) and IL-1β protein (D) after empagliflozin treatment. (E) The protein expression of IκBα and p65. #p<0.05.