
Figures & data
Table 1 Clinical Characteristics of Patients with Asthma, COPD and Control Group
Table 2 Characteristics and Mediators of Sputum in Asthma, COPD and Control Group
Table 3 Logistic Regression Model of Biochemical and Clinical Features for Discrimination of Asthma and COPD Patients
Table 4 Clinical Characteristics of Patients in Two Identified Clusters
Table 5 Characteristics and Mediators of Sputum in Two Main Identified Clusters
Figure 1 Hierarchical clustering heatmap of asthma and COPD patients based on clinical, sputum cytokine and cellular features. The rows and columns are ordered based on the results of hierarchical clustering with dendrograms for the patients shown on the horizontal axis and clinical and laboratory data shown on the vertical axis. The colour scale codes normalized value of a variable with red corresponding to the highest value.
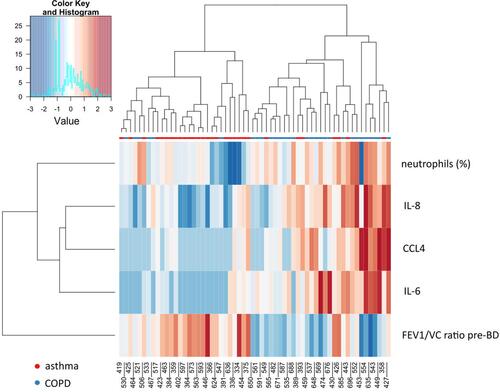
Table 6 Clinical Characteristics of Patients from the Main Two Clusters Divided According to Asthma or COPD Diagnosis
Table 7 Characteristics and Mediators of Sputum in Patients from the Main Two Clusters Divided According to Asthma or COPD Diagnosis