Figures & data
Table 1 Primer Sequences for Real-Time qPCR Analyses
Figure 1 Rb1 attenuates cardiac hypertrophy in Ang II–infused mice. C57BL/6J mice were subcutaneously infused with Ang II (1 μg/kg/min) or saline (sham) for 14 days. Ang II–infused mice received daily treatment of either vehicle (Ang II) or Rb1 at 6.25 mg/kg (Rb1-L), 25 mg/kg (Rb1-M) and 100 mg/kg (Rb1-H). (A) At the end of the indicated treatments, hearts were dissected and photographed. Additionally, H&E staining of the cardiac sections was performed to visualize the gross morphology of the heart. (B) The ratios of heart weight (HW) to body weight (BW) (left panel) and HW to tibia length (TL) (right panel) were measured (n=6-10 per group). (C) Heart sections were stained with wheat germ agglutinin (WGA) to visualize cardiomyocytes. (D) The cross-sectional area of cardiomyocytes was measured in WGA-stained heart sections (n=5 per group). Scale bar, 50 μm. (E). C57BL/6J mice were subcutaneously infused with Ang II (1 μg/kg/min) or saline (sham) for 14 days. Ang II–infused mice received daily treatment of either vehicle (Ang II) or Rb1 at 100 mg/kg (Rb1). The mRNA expression of Nppa, Nppb and Myh7 in the heart was analyzed by real-time qPCR (n=6-7 per group). 18S rRNA was used as the internal reference. Relative fold change was plotted against that from the sham controls. Data were expressed as mean±S.E.M. * P<0.05, ** P<0.01, *** P<0.001.
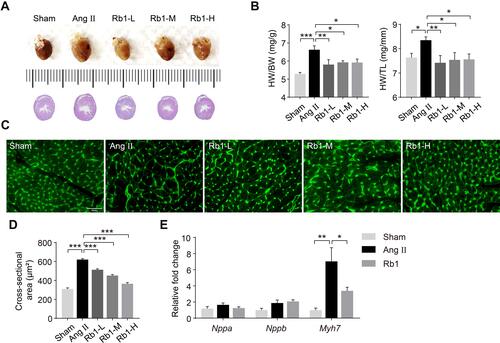
Figure 2 Rb1 alleviates cardiac fibrosis in Ang II–infused mice. C57BL/6J mice were subcutaneously infused with Ang II (1 μg/kg/min) or saline (sham) for 14 days. Ang II–infused mice received daily treatment of either vehicle (Ang II) or Rb1 at 6.25 mg/kg (Rb1-L), 25 mg/kg (Rb1-M) and 100 mg/kg (Rb1-H). (A) Cardiac morphology was examined by H&E staining of paraffin-embedded heart sections. Scale bar, 50 μm. (B) Picrosirius Red staining was performed to visualize the collagen fibers in the heart sections. Scale bar, 50 μm. Perivascular (C) and interstitial fibrosis area (D) was measured in Picrosirius Red-stained heart sections (n=5 per group). Data were expressed as mean±S.E.M. * P<0.05, *** P<0.001.
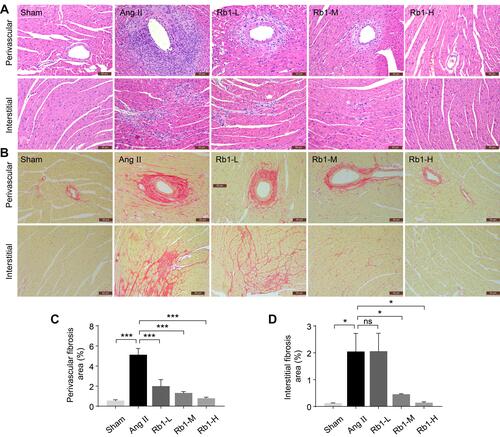
Figure 3 Rb1 protects against the ultrastructural impairment of cardiomyocytes in Ang II–infused mice. C57BL/6J mice were subcutaneously infused with Ang II (1 μg/kg/min) or saline (sham) for 14 days. Ang II–infused mice received daily treatment of either vehicle (Ang II) or Rb1 at 6.25 mg/kg (Rb1-L), 25 mg/kg (Rb1-M) and 100 mg/kg (Rb1-H). Transmission electron microscopy (TEM) was performed to examine the ultrastructure of myocardium. (A) Representative TEM images showed impaired mitochondria (red arrowheads) and Z-discs (blue arrowheads). Top row: scale bar, 5 μm. Bottom row: scale bar, 2 μm. (B) The percentage of impaired mitochondria was quantified. (C) The number of Z-discs was quantified. Data were expressed as mean±S.E.M (n=3 per group). * P<0.05, ** P<0.01, *** P<0.001.
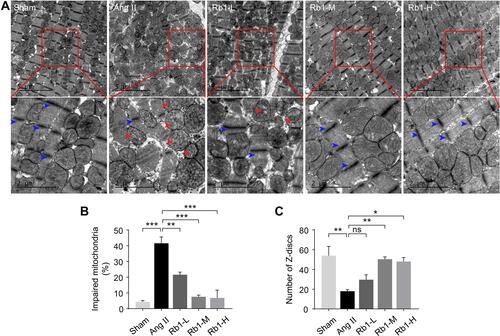
Figure 4 Rb1 mitigates inflammation in Ang II–infused mice. C57BL/6J mice were subcutaneously infused with Ang II (1 μg/kg/min) or saline (sham) for 14 days. Ang II–infused mice received daily treatment of either vehicle (Ang II) or Rb1 at 6.25 mg/kg (Rb1-L), 25 mg/kg (Rb1-M) and 100 mg/kg (Rb1-H). (A) Plasma was isolated and analyze by ELISA for the level of IL-1 beta, IL-6 and TNF (n=6-8 per group). (B) Immunohistochemistry (IHC) was performed to examine the presence of CD68+ cells (in red) in the heart. DAPI (in blue) was counterstained to help visualize the nuclei. Scale bar, 50 μm. (C) The number of CD68+ cells in the heart was quantified (n=5 per group). (D) IHC was performed to reveal the presence of CD11b+ cells (in red) in the heart. DAPI (in blue) counterstaining was performed to visualize the nuclei. Scale bar, 50 μm. (E) The number of CD11b+ cells in the heart was quantified (n=5 per group). (F). C57BL/6J mice were subcutaneously infused with Ang II (1 μg/kg/min) or saline (sham) for 14 days. Ang II–infused mice received daily treatment of either vehicle (Ang II) or Rb1 at 100 mg/kg (Rb1). The cardiac expression of Il1b, II6, and Tnf was analyzed by real-time qPCR (n=6-7 per group). 18S rRNA was included as the internal control. Relative fold change was plotted against that from the sham controls. Data were expressed as mean±S.E.M. * P<0.05, ** P<0.01, *** P<0.001.
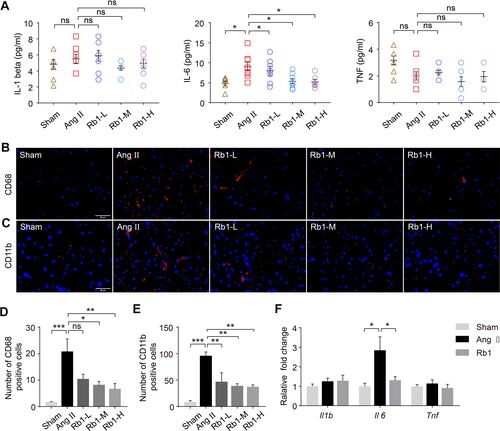
Figure 5 Rb1 antagonizes Ang II–induced hypertrophic responses in cardiomyocytes. H9c2 cells were pretreated with vehicle or Rb1 at the indicated concentrations for 30 min, followed by incubation in the presence or absence of Ang II (1 μM) for 48 h. (A) Rhodamine phalloidin staining (in red) was performed to label myofibril in the cells. DAPI counterstaining was performed to visualize the nuclei. Scale bar, 50 μm. (B) The size of H9c2 cells was measured after rhodamine phalloidin staining (n=6 per group). (C) H9c2 cells were pretreated with vehicle or Rb1 (50 μM) for 30 min, followed by incubation in the presence or absence of Ang II (1 μM) for 48 h. ANP (in red) and DAPI (in blue) staining was then performed to visualize intracellular ANP and nuclei, respectively. Scale bar, 50 μm. (D) The fluorescence intensity of ANP was measured and the relative fold change was plotted against that from the vehicle-treated cells (n=6 per group). Data were expressed as mean±S.E.M. *** P<0.001.
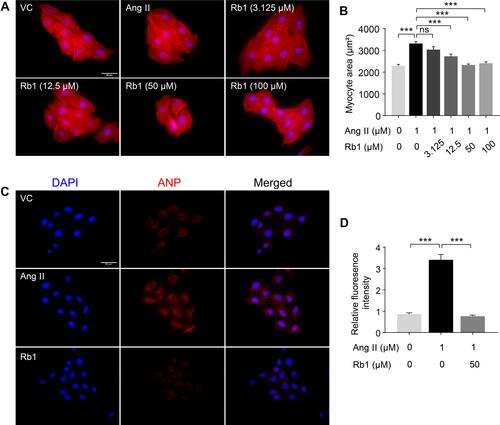
Figure 6 Rb1 protects against Ang II–induced impairment of mitochondrial function in cardiomyocytes. H9c2 cells pretreated with vehicle or Rb1 (50 μM) were incubated in the presence or absence of Ang II (1 μM) for 48 h. (A) MMP was analyzed by JC-1 staining, by which J-aggregates (in red) and J-monomers (in green) could be visualized by fluorescence microscopy. DAPI (in blue) was counterstained to visualize the nuclei. Scale bar, 50 μm. (B) The relative ratio of J-aggregates to J-monomers was plotted against that from the vehicle-treated cells (n=5 per group). (C) Calcein staining was performed to assess mPTP opening. Scale bar, 50 μm. (D) Relative fluorescence intensity of the calcein signal was plotted against that from the vehicle-treated cells (n=5 per group). Data were expressed as mean±S.E.M. ** P<0.01, *** P<0.001.
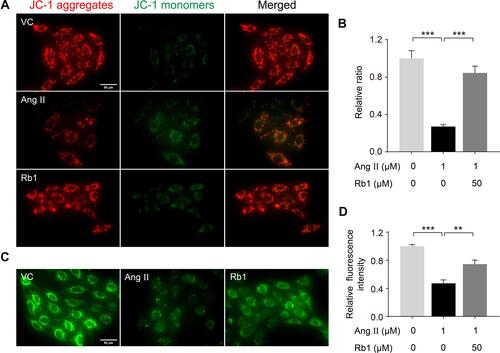
Figure 7 Rb1 suppresses the inflammatory responses in LPS-stimulated macrophages. RAW264.7 cells were treated with vehicle or Rb1 at the indicated concentrations, followed by incubation in the presence or absence or LPS (5 ng/mL) for 4 h or 24 h. Cell culture supernatants or cells were then collected for the indicated analyses. ELISA was performed to analyze the level of IL-1 beta, IL-6 and TNF 4 h (A) and 24 h (B) after LPS incubation (n=6 per group). (C) Real-time qPCR was performed to analyze the mRNA expression of Il1b, Il6, and Tnf 4 h after LPS incubation (n=6 per group). 18S rRNA was included as the internal reference. Relative fold change was plotted against that from the vehicle-treated cells. Data were expressed as mean±S.E.M. *** P<0.001.
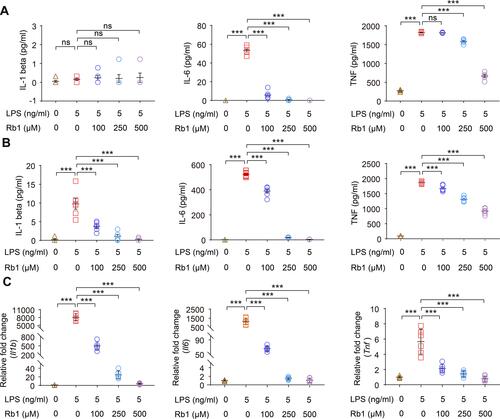
Figure 8 Rb1 attenuates the activation of MAPKs and MEK1/2 in LPS-stimulated macrophages RAW264.7 cells were treated with vehicle or Rb1 (100 μM), followed by incubation in the presence or absence of LPS (5 ng/mL) for 30 min or 6 h. Western blotting was performed to examine the level of p-Erk1/2, Erk1/2 (A), p-JNK, JNK (B), p-p38 and p38 (C) and p-MEK1/2, MEK1/2 (D) in the cells (n=4-6 per group). β-tubulin was probed for the normalization purposes. Densitometry was measured to quantify the protein signals. Relative fold change was plotted against that from the vehicle-treated cells. Data were expressed as mean±S.E.M. * P<0.05, ** P<0.01, *** P<0.001.
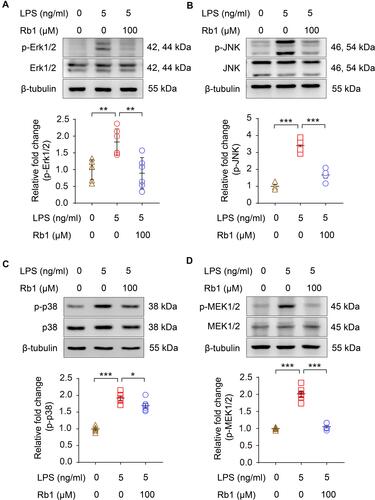
Figure 9 Rb1 suppresses the production of IL-6 in part through downregulating miR-155 in macrophages. RAW264.7 cells were treated with vehicle or Rb1 at the indicated concentrations, followed by LPS (5 ng/mL) incubation for 4 h. (A) Real-time qPCR was performed to analyze the expression of miR-155 in the cells (n=4-6 per group). RNU6B was analyzed in parallel for the normalization purposes. (B) Bone marrow-derived macrophages (BMDMs) were treated with vehicle or Rb1 (250 μM), followed by incubation in the presence or absence of Ang II (1 μM) starting from the day 3 in culture. Cells were collected after 6 days of continuous intervention. Real-time qPCR was performed to analyze the expression of miR-155 in BMDMs (n=6 per group). RNU6B was analyzed in parallel for the normalization purposes. (C) BMDMs were treated with vehicle or Rb1 (250 μM), followed by incubation in the presence or absence of Ang II (1 μM) starting from the day 3 in culture. Cells were collected after 6 days of continuous intervention. Real-time qPCR was performed to analyze the expression of Il1b, Il6 and Tnf in BMDMs (n=6 per group). 18S rRNA was analyzed in parallel for the normalization purposes. For the expression analyses in (A–C), relative fold change was plotted against that from the vehicle-treated cells. RAW264.7 cells were transfected with agomir-155 (100 nM) or agomir-NC (100 nM), treated with vehicle or Rb1 (100 μM) and exposed to LPS (5 ng/mL) for 4 h. The mRNA expression of Il6 (D) and the production of IL-6 in cell culture supernatant (E) were then analyzed by real-time qPCR and ELISA, respectively (n=6 per group). For real-time qPCR analysis of Il6 expression, 18S rRNA was analyzed in parallel for the normalization purposes. Relative fold change was plotted against that from vehicle-treated agomir-NC transfected cells. Data were expressed as mean±S.E.M. * P<0.05, ** P<0.01, *** P<0.001.
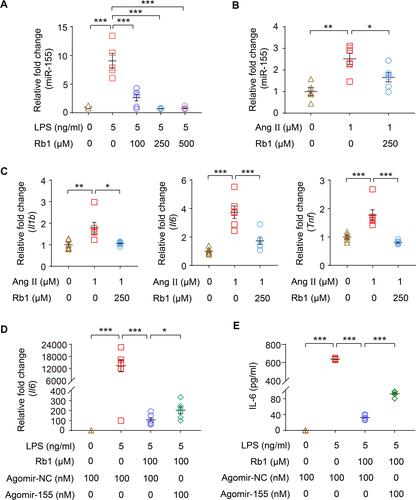
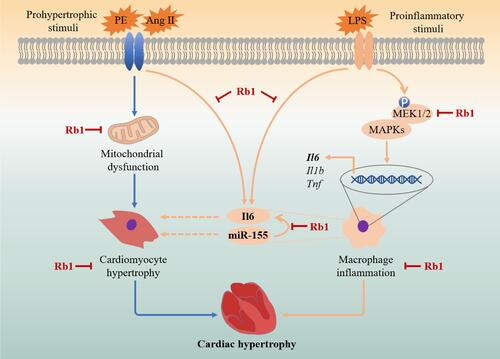
Figure 10 A schematic drawing summarizing the pharmacological mechanisms of Rb1 in the treatment of cardiac hypertrophy. In cardiomyocytes, Rb1 directly protects against pro-hypertrophic stimuli-induced cardiomyocyte hypertrophy in part through maintaining mitochondrial function. In macrophages, Rb1 mitigates inflammatory responses in activated macrophages in part through suppressing MAPK signaling and MEK1/2 activation. Furthermore, miR-155 is partially involved in the inhibitory effect of Rb1 on IL-6 production in activated macrophages. The suppressive effects of Rb1 on the expression of miR-155 and the production of IL-6 in activated macrophages suggest that Rb1 may modulate the crosstalk between activated macrophages and cardiomyocytes in cardiac hypertrophy. Dashed lines: published findings from reference 7 and 23–26. Solid lines: the results of the current work.