Figures & data
Table 1 Demographic Data of Patients with ALL and Pneumonia
Figure 1 Plasma of IL-6 levels in ALL-afflicted patients and mice. (A) Plasma IL-6 levels in ALL and pneumonia-afflicted patients, as determined by Bio-Plex human cytokines 27-plex. **p < 0.01, ALL-afflicted patients versus pneumonia-afflicted patients. (B) Plasma IL-6 levels in the control, ALL, and ALL treated with S3I-201 and TCZ mice groups, as determined by ELISA. **p < 0.01 versus the control group.
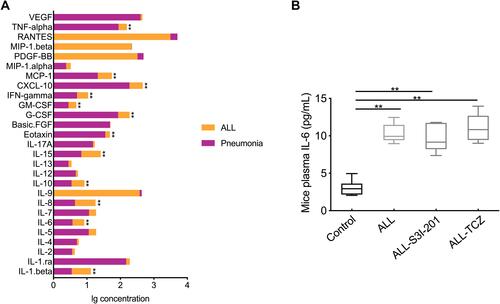
Figure 2 Expression of MRPs transporters in HK-2. (A) HK-2 cells were exposed to 10 ng/mL IL-6 with STAT3 and PXR siRNA for subsequent Western blotting. (B–D) Protein expression of targeted transporters was quantified and is viewed in the bar graphs. *p < 0.05, **p < 0.01, versus control group. (E) The fold change with respect to mRNA expression of STAT3, PXR, MRP2, and MRP4 in HK-2 cells treated with IL-6 (10 ng/mL) compared to HK-2 cells. **p < 0.01, versus control group.
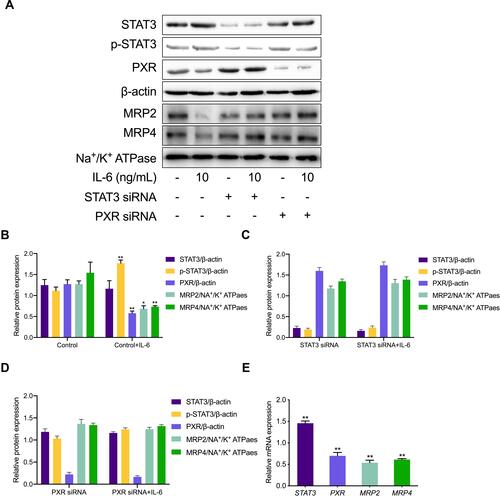
Figure 3 Pharmacokinetics of MTX was evaluated using Tocilizumab and S3I-201 in NOD/SCID mice, followed by assessment using HPLC-MS/MS. (A) Clearance of MTX in ALL mice treated with TCZ. (B) Clearance of MTX in ALL mice treated with S3I-201. (C) AUC of MTX in ALL mice treated with TCZ. (D) AUC of MTX in ALL mice treated with S3I-201.
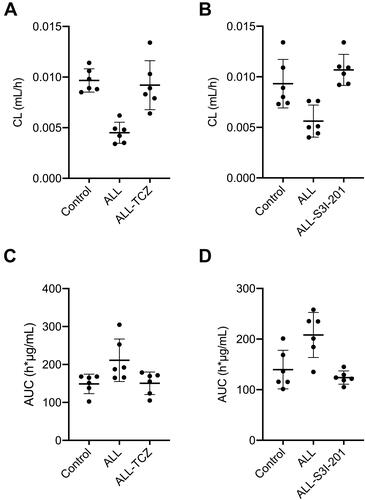
Figure 4 Expression of targeted renal proteins and mRNA in NOD/SCID mice treated with Tocilizumab. (A) Expression of target proteins in NOD/SCID mice detected using Western blotting. (B) Expression of targeted proteins was quantified and can be seen in the bar graphs. *p < 0.05, **p < 0.01, versus the control group; #p < 0.05, ##p < 0.01, the ALL-TCZ group versus the ALL group. (C) The fold change with respect to mRNA expression of Stat3, Pxr, Mrp2, and Mrp4 in NOD/SCID mice. *p < 0.05, **p < 0.01, versus the control group.
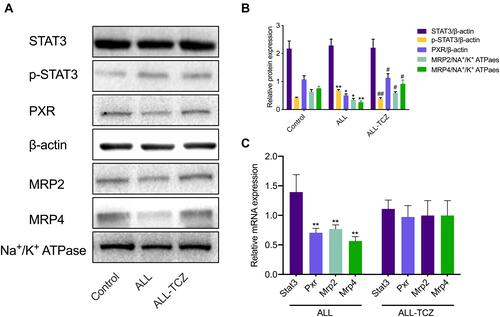
Figure 5 Expression of targeted renal proteins and mRNA in NOD/SCID mice treated with S3I-201. (A) Expression of target proteins in NOD/SCID mice kidney detected using Western blotting. (B) Expression of targeted proteins was quantified and can be seen in the bar graphs. *p < 0.05, **p < 0.01, versus the control group; #p < 0.05, ##p < 0.01, the ALL-S3I-201 group versus the control group. (C) The fold change with respect to mRNA expression of Stat3, Pxr, Mrp2, and Mrp4 in NOD/SCID mice. *p < 0.05, **p < 0.01, versus the control group.
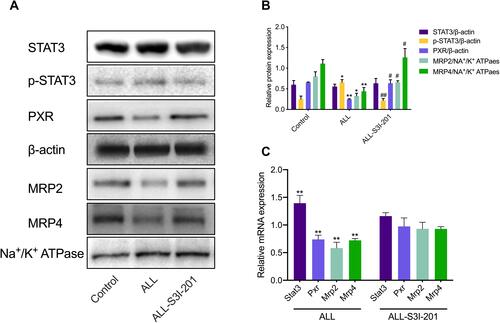
Figure 6 Immunohistochemical analysis for kidney tissues from NOD/SCID mice treated with S3I-201. Immunohistochemical expression of target proteins in NOD/SCID mice kidney. Expression of STAT3, PXR, MRP2, and MRP4 proteins in the kidneys using immunocytochemistry. Original magnification × 400. Arrowheads represent positive signals for transporter proteins.
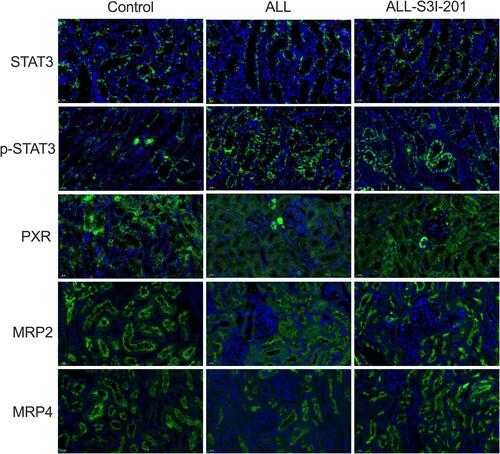
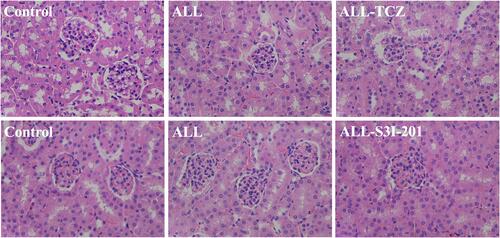
Figure 7 HE-staining analyses for kidneys from NOD/SCID mice treated with S3I-201 and Tocilizumab. H&E staining of kidneys indicated a lack of significant differences in kidney histological structure among comparisons of the six groups NOD/SCID mice. Representative images of HE-stained kidney sections. Original magnification × 400.