Figures & data
Figure 1 Flowchart of the included patients in the primary cohort (A) and validation cohort (B).
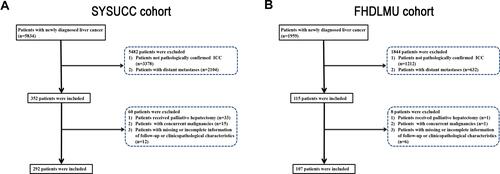
Table 1 Clinicopathological and Radiological Characteristics of Primary and Validation Cohorts
Figure 2 Feature selection using the least absolute shrinkage and selection operator (LASSO) Cox regression model. LASSO coefficient profiles of 82 variables against the log (Lambda) sequence for OS (A) and tuning parameter (Lambda) selection in the LASSO model used 10-fold cross-validation via minimum criteria for OS (B). LASSO coefficient profiles of 82 variables against the log (Lambda) sequence for PFS (C) and tuning parameter (Lambda) selection in the LASSO model used 10-fold cross-validation via minimum criteria for PFS (D).
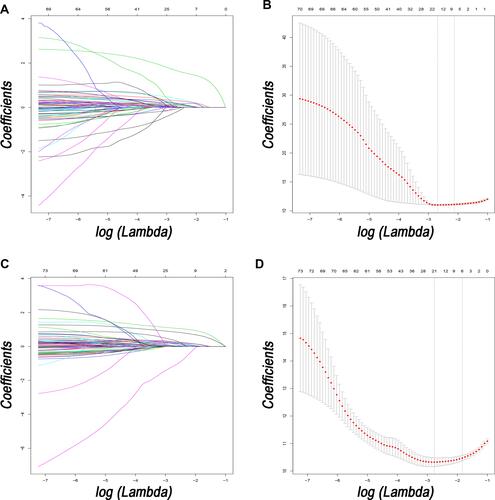
Figure 3 Nomogram for predicting the 1- and 2-year OS (A) and PFS (B) rates in patients with ICC after resection.
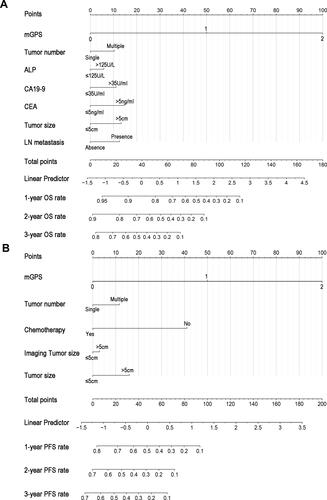
Figure 4 The calibration curve for predicting patient survival at 1-, 2- and 3-year OS and PFS in the primary (A and B) and validation (C and D) cohorts, respectively.
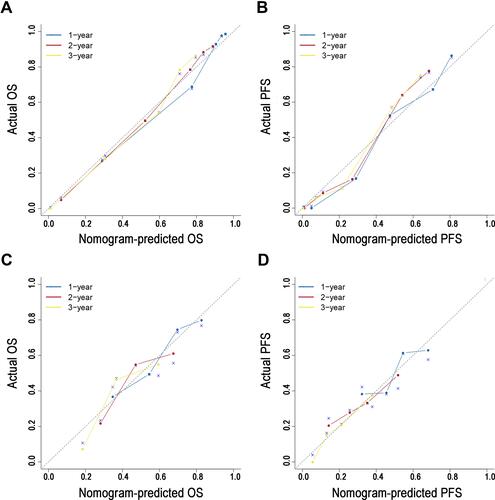
Table 2 The Comparisons of ROC and C-Index Values in Primary and Validation Cohorts
Figure 5 Comparisons of ROC curves of the nomogram, TNM staging system, BCLC staging score, CLIP score, and Okuda staging system for 1-, 2- and 3-year OS in the primary (A–C) and validation (D–F) cohorts.
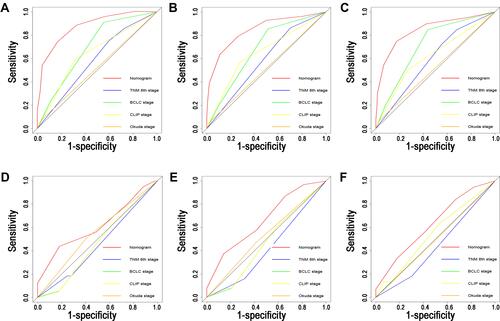
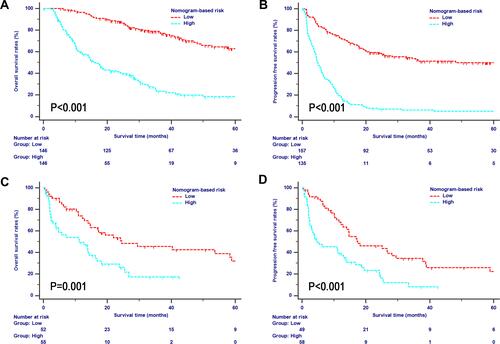
Figure 6 OS and PFS analyses stratified by nomogram-based risk scores of ICC patients after resection in the primary (A and B) and validation (C and D) cohorts.