Figures & data
Figure 1 Effects of AS-IV on PM2.5-induced lung injury in rats. (A) HE staining of lung tissues from Con, AS-IV, PM2.5, AS-IV 50, AS-IV 100, 3-MA, and AS-IV 100+3-MA groups. (Black arrows represent hemorrhage, green arrows represent clear inflammatory cells, and blue arrows represent inflammatory exudate). (Magnification 200× for the upper row and 400× for the lower row, Scale bar = 50 μm). (B) Semiquantitative histopathological score of lung injury. (C) Effect of AS-IV on lung wet/dry ratio of PM2.5-induced lung injury. (D) Effect of AS-IV on CRP, IL-6, and TNF-α in the BALF in PM2.5-induced lung injury. (E) Effect of AS-IV on CAT, MDA, and SOD in the lung tissues in PM2.5-induced lung injury. Data are mean±SEM (n=6-7). ##P<0.01, ###P<0.001, and ####P<0.0001 compared with control group; *P<0.05, **P<0.01, ***P<0.001, and ****P<0.0001 compared with PM2.5 group; &P<0.05, and &&P<0.01 compared with AS-IV 100 group; @P<0.05, @@P<0.01, @@@P<0.001, and @@@@P<0.0001 compared with 3-MA group.
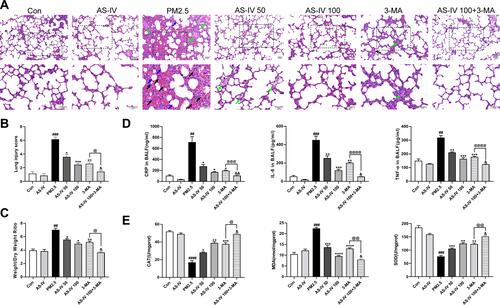
Figure 2 AS-IV restores impaired autophagy in lung tissues from rats exposed to PM2.5. (A–D) The levels of LC3B and p62 were determined by Western blot analysis (n=6-7). (E) Immunofluorescence staining of LC3B in lung tissues (Magnification 200×, Scale bar = 100 μm). (F) The relative fluorescent intensity of LC3B in lung tissues (n=6-7). (G) TEM was utilized to visualize autophagic vacuoles (autophagosomes, Avi; autolysosomes, Avd) in alveolar macrophages. (n =3, Magnification 2000× for the upper row and 5000× for the lower row, Scale bar = 10 μm). (H) Qualitative analysis of the number of autophagic vacuoles in alveolar macrophages under TEM. Data are mean±SEM. ##P<0.01, and ####P<0.0001 compared with control group; *P<0.05, **P<0.01, and ***P<0.001 compared with PM2.5 group; &P<0.05, and &&&P<0.001 compared with AS-IV 100 group; @P<0.05, @@P<0.01, and @@@P<0.001 compared with 3-MA group.
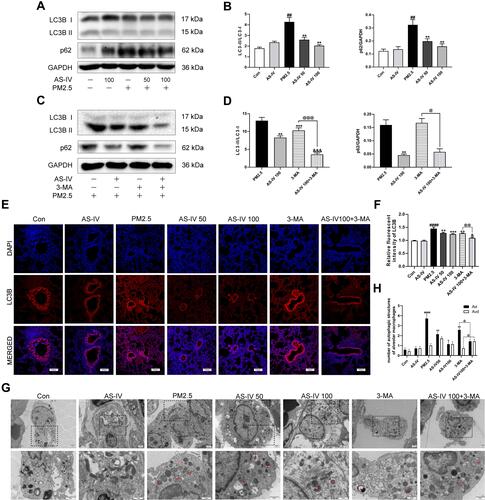
Figure 3 AS-IV inhibits the PI3K/Akt/mTOR pathway in lung tissues from rats exposed to PM2.5. (A–D) The levels of p-PI3K, PI3K, p-AKT, AKT, p-mTOR, and mTOR were determined by Western blot analysis. (E) Effects of p-PI3K, p-AKT, and p-mTOR expression in lung tissues by immunohistochemistry staining. (Magnification 200×, Scale bar = 50 μm). (F) Statistical chart of positive expression of p-PI3K, p-AKT, and p-mTOR proteins. Graphs represent mean±SEM (n=6-7). ##P<0.01, ###P<0.001, and ####P<0.0001 compared with control group; *P<0.05, **P<0.01, and ***P<0.001 compared with PM2.5 group; &P<0.05, &&P<0.01, and &&&P<0.001 compared with AS-IV 100 group; @P<0.05, @@@P<0.001, and @@@@P<0.0001 compared with 3-MA group.
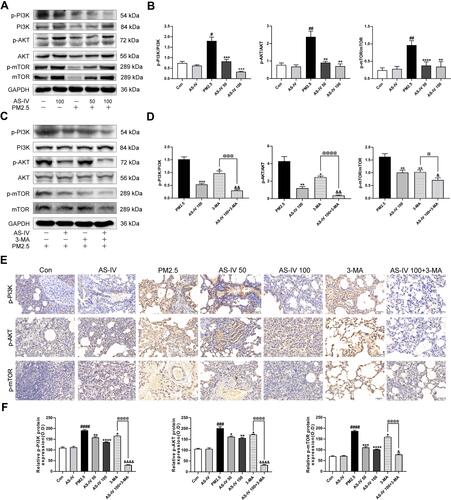
Figure 4 AS-IV inhibits the NF-κB translocation in lung tissues from rats exposed to PM2.5. (A–D) The levels of cytoplasmic and nuclear p65 were determined by Western blot analysis. Graphs represent mean±SEM (n=6-7). ##P<0.01 compared with control group; *P<0.05, **P<0.01, ***P<0.001, and ****P<0.0001 compared with PM2.5 group; &&P<0.01 compared with AS-IV 100 group; @@@@P<0.0001 compared with 3-MA group.
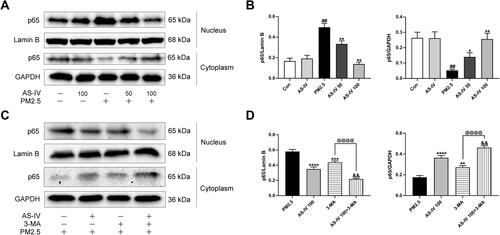
Figure 5 AS-IV restores impaired autophagy in PM2.5-induced NR8383 cells. (A) Cell viability was measured in AS-IV-treated (0.01, 0,1, 1, 10, 25, 50, 75, or 100 μM; 12 h) NR8383 cells by CCK-8 assays (n=3). (B and C) The levels of LC3B and p62 were determined by Western blot analysis (n=3). (D and E) NR8383 cells were treated with AS-IV (50 μM), 3-Ma (5 mM), or PM2.5 (50 μg/mL), or in combination for 24 h after transfection with GFP-LC3 plasmid (Scale bar = 20 μm). LC3 punctate-positive cells were observed by fluorescence microscopy and quantitation of the percentage of cells with punctate GFP-LC3 fluorescence per total GFP-LC3-positive cells. Data represent mean SEM calculated from three experiments of 100 transfected cells each. (F) TEM was utilized to visualize autophagic vacuoles (autophagosomes, Avi; autolysosomes, Avd) in NR8383 cells (n =3, Magnification 12,000× for the upper row and 20,000× for the lower row, Scale bar=1 μm). Graphs represent mean±SEM. ####P<0.0001 compared with DMSO group; *P<0.05, **P<0.01, ***P<0.001, and ****P<0.0001 compared with PM2.5 group; &P<0.05 and &&P<0.01 compared with AS-IV 50 group; @@@@P<0.0001 compared with 3-MA group.
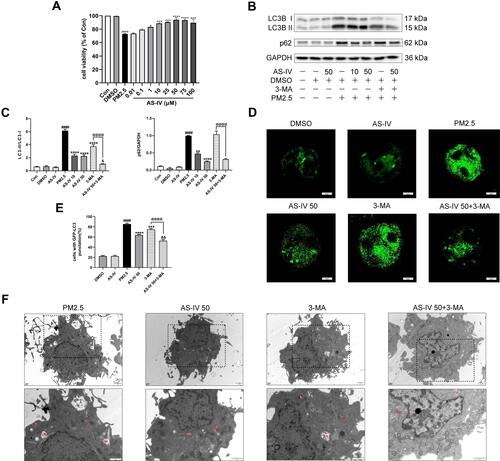
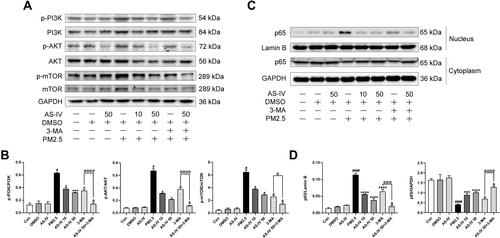
Figure 6 AS-IV inhibits the PI3K/Akt/mTOR pathway and NF-κB translocation in PM2.5-induced NR8383 cells. (A and B) The levels of p-PI3K, PI3K, p-AKT, AKT, p-mTOR, and mTOR were determined by Western blot analysis. (C and D) The levels of cytoplasmic and nuclear p65 were determined by Western blot analysis. Graphs represent mean±SEM (n=3). #P<0.05, and ####P<0.0001 compared with DMSO group; *P<0.05, ***P<0.001, and ****P<0.0001 compared with PM2.5 group; &P<0.05 compared with AS-IV 50 group; @P<0.05, @@@P<0.001, and @@@@P<0.0001 compared with 3-MA group.