
Figures & data
Table 1 Clinical Responses to First-Generation EGFR-TKIs Combined with Chemotherapy in Advanced NSCLC Patients Harboring EGFR Mutations by Demographic and Clinical Characteristics
Figure 1 Maximum tumor change from baseline by the best overall response, as per Response Evaluation Criteria in Solid Tumors (RECIST) version 1.1, each bar represents the maximum change in the sum of the diameters of the target lesions of an individual patient.
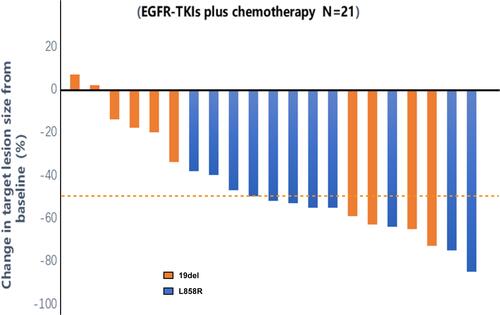
Figure 2 Kaplan-Meier estimates of survival. (A) Progression-free survival; (B) overall survival; (C) comparison of progression-free survival between advanced NSCLC patients harboring EGFR 19del and L858R mutations; (D) comparison of overall survival between advanced NSCLC patients harboring EGFR 19del and L858R mutations.
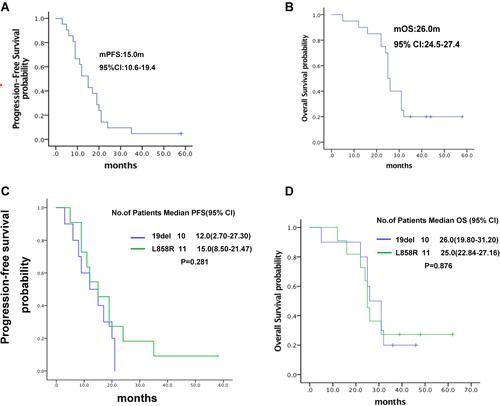
Table 2 Toxicities During the Treatment with First-Generation EGFR-TKIs in Combination with Chemotherapy in Advanced NSCLC Patients Harboring EGFR Mutations