Figures & data
Table 1 The Sequence of Primers and the Size of PCR product
Table 2 The Sequence of Primers
Figure 1 P2X receptors expression and ATP-induced calcium response in mouse peritoneal mast cells. (A) P2X1R, P2X3R, P2X4R and P2X7R expressed in mouse peritoneal mast cells. (B) Heat map of [Ca2+]i (top) and example traces (bottom) mediated by different concentrations of extracellular ATP (Scal bar=10 μm). (C) The fluorescence intensity of Ca2+ induced by different concentrations of ATP from 0.01 to 5000 µM, and the EC50 was about 6.5 µM. (D) Calcium influx induced by 1 µM ATP was inhibited by PPADS or NF449 (****p < 0.0001, control vs PPADS or NF449). (E) Calcium influx induced by 10 µM ATP was blocked by PPADS or AF-353 (****p < 0.0001, control vs PPADS or AF-353). (F) Calcium influx induced by 100 µM ATP was blocked by PPADS or 5-BDBD (****p < 0.0001, control vs PPADS or 5-BDBD). (G) Calcium influx induced by 1 mM ATP was blocked by PPADS or AZ10606120 (****p < 0.0001, control vs PPADS or AZ10606120). (H) Calcium influx induced by 5 mM ATP was blocked by PPADS or AZ10606120 (****p < 0.0001, control vs PPADS or AZ10606120). (Statistical analysis of the results was performed by one-way ANOVA analysis followed by Dunn’s multiple comparisons test).
![Figure 1 P2X receptors expression and ATP-induced calcium response in mouse peritoneal mast cells. (A) P2X1R, P2X3R, P2X4R and P2X7R expressed in mouse peritoneal mast cells. (B) Heat map of [Ca2+]i (top) and example traces (bottom) mediated by different concentrations of extracellular ATP (Scal bar=10 μm). (C) The fluorescence intensity of Ca2+ induced by different concentrations of ATP from 0.01 to 5000 µM, and the EC50 was about 6.5 µM. (D) Calcium influx induced by 1 µM ATP was inhibited by PPADS or NF449 (****p < 0.0001, control vs PPADS or NF449). (E) Calcium influx induced by 10 µM ATP was blocked by PPADS or AF-353 (****p < 0.0001, control vs PPADS or AF-353). (F) Calcium influx induced by 100 µM ATP was blocked by PPADS or 5-BDBD (****p < 0.0001, control vs PPADS or 5-BDBD). (G) Calcium influx induced by 1 mM ATP was blocked by PPADS or AZ10606120 (****p < 0.0001, control vs PPADS or AZ10606120). (H) Calcium influx induced by 5 mM ATP was blocked by PPADS or AZ10606120 (****p < 0.0001, control vs PPADS or AZ10606120). (Statistical analysis of the results was performed by one-way ANOVA analysis followed by Dunn’s multiple comparisons test).](/cms/asset/07b638c2-672c-453d-864c-3f6e9416cd66/djir_a_12190307_f0001_c.jpg)
Figure 2 Characteristics of inward currents in mouse peritoneal mast cells evoked by different concentrations of ATP. (A–D) Different currents induced by various concentrations of ATP (1 µM, 100 µM, 1 mM and 5 mM ATP respectively). (E) The current amplitude induced by various concentrations of extracellular ATP was different (**p < 0.01, 1 µM vs 10 µM, **p < 0.01, 10 µM vs 100 µM, ***p < 0.001, 1 mM vs 5 mM, one-way ANOVA analysis followed by Dunnett’s multiple comparisons test). (F) The duration of inward currents evoked by different concentrations of extracellular ATP was different (***p < 0.001, 1 µM vs 10 µM, 10 µM vs 100 µM, 100 µM vs 1 mM, 1 mM vs 5 mM, one-way ANOVA analysis followed by Dunnett’s multiple comparisons test). (G and H) The “run-up” tendency of inward currents induced by 1 mM ATP and 5 mM ATP. (I) No significant changes in the growth rate between 1 mM ATP- and 5 mM ATP-induced currents. (J) Stimulation protocol. (K) The different currents under this protocol stimulation. (L) The relationship curve of voltage-current. (M) The activate curves and inactivate curves induced by 5 mM ATP. (N) The conductance curve induced by 5 mM ATP.
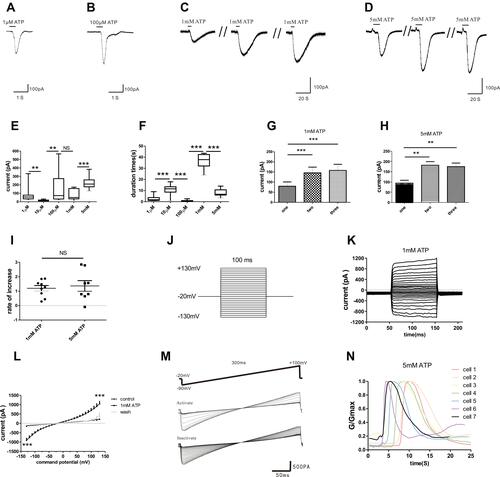
Figure 3 The effects of specific blockers on the currents evoked by extracellular ATP. (A) Cell with 20 µM PPADS or 1 µM NF449 hardly evoke current by 1 µM ATP treatment. (B) Current evoked by 10 µM ATP could be blocked by 20 µM PPADS or 0.1 µM AF-353. (C) The current induced by 100 µM ATP could be inhibited by 20 µM PPADS or 10 µM 5-BDBD. (D) The current induced by 1 mM ATP could be blocked by 1 µM AZ10606120. (E) 1 µM AZ10606120 could reduce the current evoked by 5 mM ATP. (F) 5 mM ATP could evoke greater inward current in the external solution with low divalent cation. (G) The current amplitude induced by 1 µM ATP could be inhibited by PPADS or NF449 (****p < 0.0001, control vs 20 µM PPADS, n=9, ***p < 0.001, control vs 1 µM NF449, n=13, one-way ANOVA analysis followed by Dunnett’s multiple comparisons test). (H) The current amplitude evoked by 10 µM ATP was blocked by PPADS or AF-353 (****p < 0.0001, control vs 20 µM PPADS, n=9, *p < 0.05, control vs 0.1 µM AF-353, n=10, one-way ANOVA analysis followed by Dunnett’s multiple comparisons test). (I) PPADS or 5-BDBD could inhibit the current amplitude evoked by 100 µM ATP (**p < 0.01, control vs 20 µM PPADS, n=13, ****p < 0.0001, control vs 10 µM 5-BDBD, n=10, one-way ANOVA analysis followed by Dunnett’s multiple comparisons test). (J) The current amplitude evoked by 1 mM ATP was blocked by AZ10606120 (*p < 0.05, control vs 1 µM AZ10606120, n=5, paired Student’s t-test). (K) The current amplitude evoked by 5 mM ATP could also be blocked by AZ10606120 (***p < 0.001, control vs 1 µM AZ10606120, n=6, paired Student’s t-test). (L) The current amplitude induced by 5 mM ATP in the external solution with low divalent cation (n=8) was greater than that in the normal external solution (n=13). (M–O) Immunofluorescence staining showed P2X7R (M, green) in mouse peritoneal mast cells, and the nucleus was stained with DAPI (N, blue) (Scale bar is 50 µm).
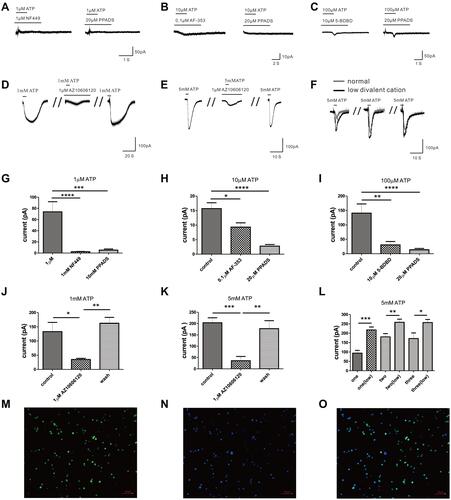
Figure 4 Effects of extracellular ATP at different concentrations on the synthesis and release of cytokines in mast cells. (A) High concentrations of ATP induced significantly increased histamine release from mouse peritoneal mast cells (*p < 0.05, control vs 5 mM ATP, one-way ANOVA analysis followed by Dunnett’s multiple comparisons test). (B) Immunofluorescence staining exhibited P2X7R (red) in P815 cells, scale bar was 50 µM. (C–E) There was no significant changes in the expression of IL-6, IL-1β, CCL2 and CCL3 in P815 cells induced by 1 μM ATP, 10 μM ATP or 100 μM ATP, respectively. (F) The expression of IL-6, IL-1β and CCL3 was up-regulated induced by 1 mM ATP in P815 cells (*p < 0.05, **p < 0.01, control vs 1 mM ATP, one-way ANOVA analysis followed by Dunn’s multiple comparisons test). (G) The expression of IL-1β and CCL3 was up-regulated induced by 5 mM ATP in P815 cells (*p < 0.05, **p < 0.01, control vs 5 mM ATP, one-way ANOVA analysis followed by Dunn’s multiple comparisons test). (H) The up-regulation of IL-1β and CCL3 expression caused by 5 mM ATP in P815 cells was blocked by specific P2X7R antagonist AZ10606120. (*p < 0.05, control vs 5 mM ATP; #p < 0.05, 5 mM ATP vs 5 μM AZ10606120, one-way ANOVA analysis followed by Tukey’s multiple comparisons test).
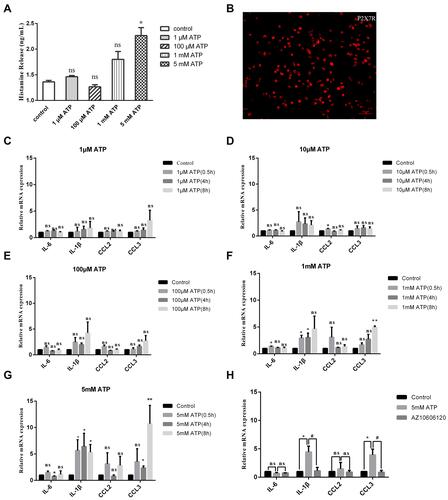
Figure 5 Mast cell deficient and AZ10606120 alleviated high concentrations of ATP-induced inflammation pain. (A) Compared with C57/BL mice, Sash mice alleviated the paw swelling. (B) Compared with the C57/BL mice, the infiltration of inflammatory cells in Sash mice was significantly reduced. (a-b, HE staining of saline and ATP groups in C57/BL mice; c-d, HE staining of saline and ATP groups in Sash mice, 250X). (C) Compared with C57BL mice, Sash mice significantly reduced paw thickening (*p < 0.05, **p < 0.01, WT group vs Sash group, n=8 and 6 respectively). (D) High concentrations of ATP induced mast cells degranulation (The construction of Mrgprb2-Cre tdT +mice was to integrate the fluorescent protein of Td/Tomato into the promoter of MrgprB2, red represented mast cells, and the small red granules around mast cells represented degranulation). (E) Sash mice alleviated the mechanical hyperalgesia induced by high concentrations of ATP (*p < 0.05, WT group vs Sash group, n=8 and 6 respectively). (F) Mast cell deficient attenuated the upregulation of IL-1β and CCL3 (**p < 0.01, ***p < 0.001, saline group vs ATP group, #p < 0.05, ##p < 0.01, WT (ATP) group vs Sash (ATP) group). (G) The infiltration of mast cells expressing P2X7R was significantly increased, which could be inhibited by Z10606120. (H) AZ10606120 significantly relieved the mechanical hyperalgesia. (*p < 0.05, **p < 0.01, ATP group vs ATP+AZ10606120 group). (I) AZ10606120 attenuated the up-regulation of IL-6 and CCL3 (*p < 0.05, ***p < 0.001, saline group vs ATP group, #p < 0.05, ###p < 0.001, WT (ATP) group vs WT (AZ+ATP) group). (Statistical analysis of the results was performed one-way ANOVA analysis followed by Dunnett’s multiple comparisons test or Tukey’s multiple comparisons test).
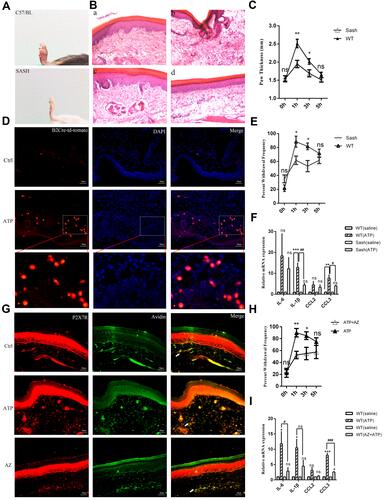
Figure 6 The effects of SA and ASA on the activation of P2X7R in mast cells. (A) Schematic diagram of the effect of SA and ASA on 5 mM ATP-induced current. (B) Compared with the first ATP-induced current amplitude, 300 μM SA had a slight inhibitory effect on the second ATP-induced current amplitude. (C) Compared with the first ATP-induced current amplitude, 500 μM SA slightly inhibited the second ATP-induced current amplitude. (D) Compared with the first ATP-induced current amplitude, 1 mM SA significantly inhibited the second ATP-induced current amplitude (**p<0.01, control vs 1 mM SA). (E) The current growth rate was significantly inhibited by different concentrations of SA (****p<0.0001, control vs 300 μM SA, 500 μM SA or 1 mM SA). (F–H) Compared with the first ATP-induced current amplitude, 500 μM (G) or 1 mM ASA (H) slightly inhibited the second ATP-induced current amplitude. (I) The current growth rate was significantly inhibited by different concentrations of ASA (*p<0.05, control vs 300 μM ASA; **p<0.01, control vs 500 μM ASA; ***p<0.001, control vs 1 mM ASA). (J) The current growth rate evoked by BzATP was significantly inhibited by 300 μM SA or 300 μM ASA (**p<0.01, control vs 300 μM SA or 300 μM ASA). (K) The up-regulation of P2X7R expression induced by 5 mM ATP was blocked by 500 μM SA or 1 mM ASA (**p<0.01, control vs ATP, ##p<0.01, ATP vs ATP+SA or ATP+ASA). (L) SA or ASA attenuated the up-regulation of IL-1β and CCL3 expression (*p<0.05, **p<0.01, control vs ATP, #p<0.05, ##p<0.01, ATP vs SA or ASA). (Statistical analysis of the results was performed one-way ANOVA analysis followed by Dunnett’s multiple comparisons test or Tukey’s multiple comparisons test).
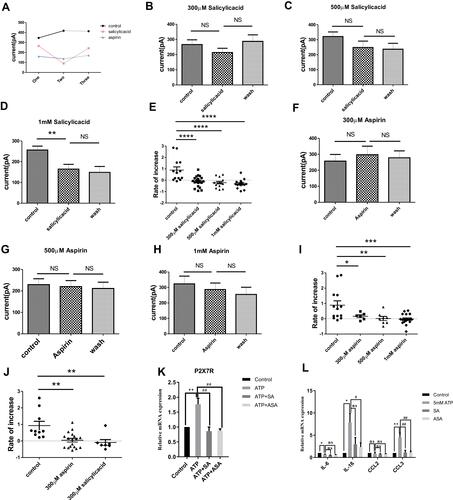
Figure 7 The effects of SA or ASA on the inflammation pain through P2X7R. (A) The infiltration of mast cells expressing P2X7R was significantly increased induced by high concentrations of ATP, which could be inhibited by SA or ASA. (B) SA or ASA relieve the mechanical hypersensitivity induced by high concentrations of ATP (*p<0.05, ATP vs ATP+SA or ATP+ASA). (C) SA or ASA attenuated the up-regulation of inflammatory factors expression (*p < 0.05, **p < 0.01, saline group vs ATP group, #p < 0.05, ##p < 0.01, WT (ATP) group vs WT (SA+ATP) or WT (ASA+ATP) group). (Statistical analysis of the results was performed one-way ANOVA analysis followed by Dunnett’s multiple comparisons test or Tukey’s multiple comparisons test).
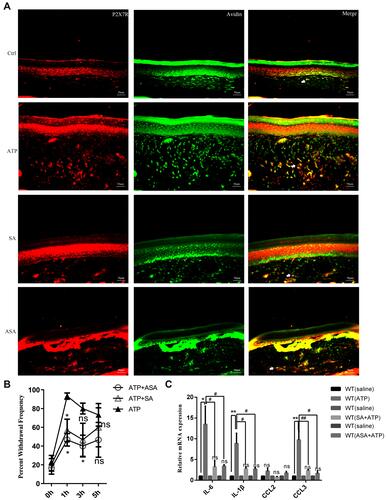
Figure 8 Molecular docking map of compounds with P2X7R. (A and B) Docking result of ASA with the (A) GDP703 ligand of P2X7R. (C and D) Docking result of ASA with the (B) GDP703 ligand of P2X7R. (E and F) Docking result of ASA with the (C) GDP704 ligand of P2X7R. (G and H) Docking result of SA with the (A) GDP703 ligand of P2X7R. (I and J) Docking result of SA with the (B) GDP703 ligand of P2X7R. (K and L) Docking result of SA with the (C) GDP704 ligand of P2X7R.
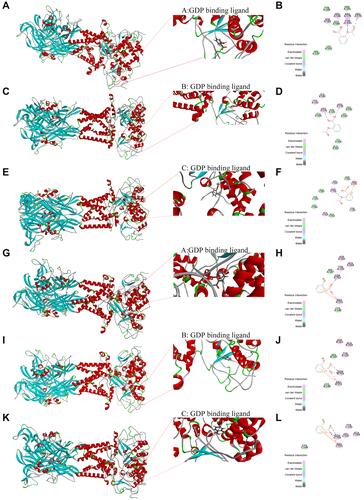
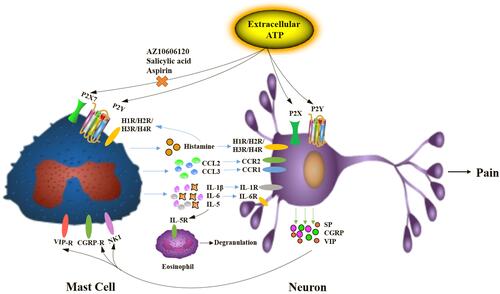
Figure 9 The mechanism of inflammation pain induced by extracellular ATP via neuron-immune crosstalk.