Figures & data
Figure 1 TNF-α-induced COX-2 expression and PGE2 production in HCFs. (A) The cells were incubated with different concentrations of TNF-α (3, 5, and 15 ng/mL) for the indicated time intervals (2, 4, 6, 16, and 24 h). The levels of COX-2 and GAPDH protein were determined by Western blot. (B) The cells were incubated with 15 ng/mL TNF-α for the indicated time intervals (0.5, 1, 2, 4, and 6 h). The levels of cox-2 and gapdh mRNA were analyzed by real-time PCR. (C) The cells were co-transfected with COX-2-luci-plasmid and β-galactosidase plasmid, and then incubated with 15 ng/mL TNF-α for the indicated time intervals (0.5, 1, 2, 4, and 6 h). The promoter activity was determined in the cell lysates using a promoter assay kit. (D) The media of 15 ng/mL TNF-α from (A) were saved to determine the levels of PGE2 synthesis using a PGE2 ELISA kit. Data are expressed as the mean ± S.E.M. of three independent experiments. #p<0.05, as compared with the control.
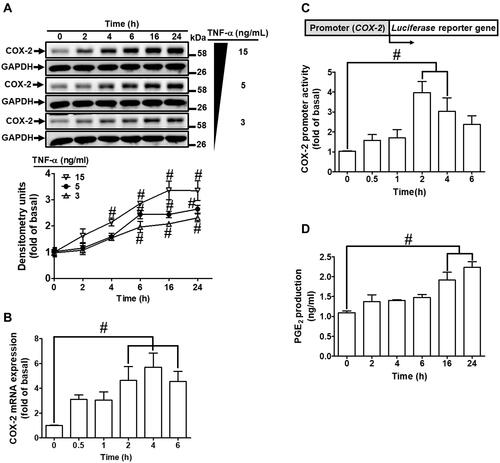
Figure 2 TNF-α-induced COX-2 expression and PGE2 production mediated through TNFR1 in HCFs. (A, B) The cells were pretreated with various concentrations of either (A) TNFR1 or (B) TNFR2 neutralized antibody for 1 h and then incubated with 15 ng/mL TNF-α for 16 h. The levels of COX-2 and GAPDH protein were determined by Western blot. (C, D) The cells were pretreated with either (C) TNFR1 nAb or (D) TNFR2 nAb for 1 h and then incubated with TNF-α (15 ng/mL) for 4 h. The levels of cox-2 and gapdh mRNA were analyzed by real-time PCR. Data are expressed as the mean ± S.E.M. of three independent experiments. #p<0.05, as compared with the control.
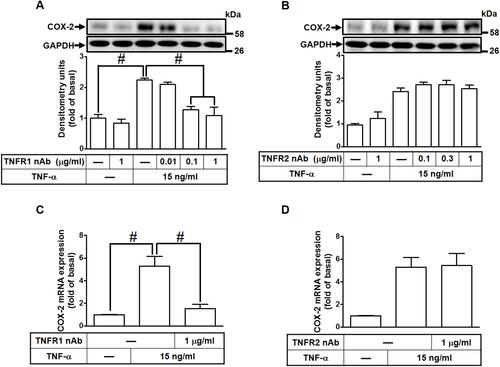
Figure 3 MitoROS generation induced by TNF-α mediates COX-2 and PGE2 upregulation. (A) HCFs were pretreated without or with 100 nM MitoTEMPO or TNFR1 nAb (1 μg/mL) for 1 h, and then incubated with 15 ng/mL TNF-α for the indicated time intervals (30 and 60 min). MitoROS production was determined by MitoSOX Red staining (scale bar = 50 µm). The fluorescence unit of MitoSOX Red was measured using a fluorescent microplate reader. (B) HCFs were pretreated with various concentrations of MitoTEMPOL (10, 30, and 100 nM) for 1 h and then incubated with 15 ng/mL TNF-α for 16 h. The levels of COX-2 and GAPDH protein were determined by Western blot. (C) The cells were pretreated with 100 nM MitoTEMPO for 1 h and then incubated with TNF-α (15 ng/mL) for 4 h. The levels of cox-2 and gapdh mRNA were analyzed by real-time PCR (open bars). Cells were co-transfected with COX-2-luci-plasmid along with a β-galactosidase plasmid, sequentially pretreated with 100 nM MitoTEMPO for 1 h, and then incubated with 15 ng/mL TNF-α for 2 h. Promoter activity was determined in the cell lysates using a promoter assay kit (solid bars). (D) The media saved from (A) were used to determine the levels of PGE2. Data are expressed as the mean ± S.E.M. of three independent experiments. #p<0.05, as compared with the control.
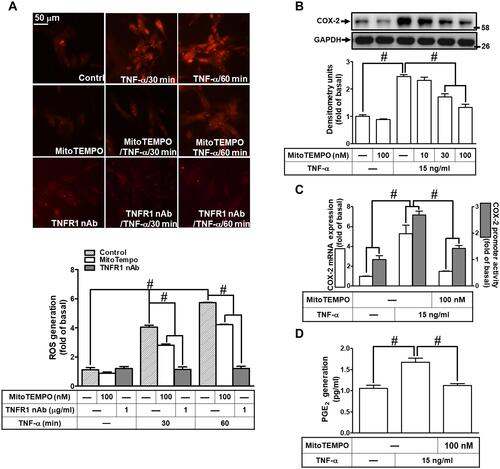
Figure 4 PKCα was involved in TNF-α-induced COX-2 expression and PGE2 production in HCFs. (A) The cells were pretreated with various concentrations of Gö6976 (1, 10, and 100 nM) for 1 h and then incubated with 15 ng/mL TNF-α for 16 h. The levels of COX-2 and GAPDH protein were determined by Western blot. (B) The cells were pretreated with 100 nM Gö6976 for 1 h and then incubated with 15 ng/mL TNF-α for 4 h. The levels of cox-2 and gapdh mRNA were analyzed by real-time PCR (open bars). Cells were co-transfected with COX-2-luci-plasmid along with a β-galactosidase plasmid, pretreated with 100 nM Gö6976 for 1 h, and then incubated with 15 ng/mL TNF-α for 1 h. Promoter activity was determined in the cell lysates using a promoter assay kit (solid bars). (C) The cells were transfected with scrambled or PKCα siRNA and then incubated with 15 ng/mL TNF-α for 16 h. The levels of COX-2, PKCα, and GAPDH proteins were analyzed by Western blot. (D) The cells were incubated with 15 ng/mL TNF-α for the indicated time intervals (5, 10, 15, 30, and 60 min). The cytosolic and membrane fractions were analyzed by Western blot to determine the levels of PKCα with Gαs and GAPDH as membrane and cytosolic internal control, respectively. (E) The cells were pretreated without or with 3 μM Gö6976, 1 μg/mL TNFR1 nAb, or 1 μM MitoTEMPO for 1 h and then incubated with 15 ng/mL TNF-α for the indicated time intervals (15, 30, and 60 min). The levels of phospho-PKCα and total PKCα proteins were analyzed by Western blot. (F) The media saved from (A) were used to determine the levels of PGE2. Data are expressed as the mean ± S.E.M. of three independent experiments. #p<0.05, as compared with the control.
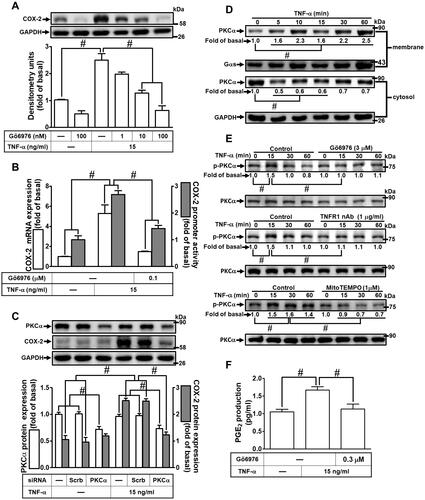
Figure 5 Involvement of p38 MAPK in TNF-α-induced COX-2 expression and PGE2 production in HCFs. (A) The cells were pretreated with various concentrations of p38 inhibitor VIII (p38i VIII; 0.01, 0.1, and 1 μM) for 1 h and then incubated with 15 ng/mL TNF-α for 16 h. The levels of COX-2 and GAPDH protein were determined by Western blot. (B) The cells were pretreated with 1 μM p38i VIII for 1 h and then incubated with 15 ng/mL TNF-α for 4 h. The levels of cox-2 and gapdh mRNA were analyzed by real-time PCR (open bars). Cells were co-transfected with COX-2-luci-plasmid along with a β-galactosidase plasmid, pretreated with 1 μM p38i VIII for 1 h, and then incubated with 15 ng/mL TNF-α for 2 h. Promoter activity was determined in the cell lysates using a promoter assay kit (solid bars). (C) The cells were transfected with scrambled or p38 MAPK siRNA and then incubated with 15 ng/mL TNF-α for 16 h. The levels of COX-2, p38 MAPK, and GAPDH proteins were analyzed by Western blot. (D) The cells were pretreated with 1 μM p38i VIII, 1 μg/mL TNFR1 nAb, 3 μM Gö6976, or 1 μM MitoTEMPO for 1 h and then incubated with 15 ng/mL TNF-α for the indicated time intervals (15, 30, and 60 min). The levels of phospho-p38 MAPK, phospho-PKCα, total p38 MAPK, and total PKCα proteins were analyzed by Western blot. (E) The media saved from (A) were used to determine the levels of PGE2. Data are expressed as the mean ± S.E.M. of three independent experiments. #p<0.05, as compared with the control.
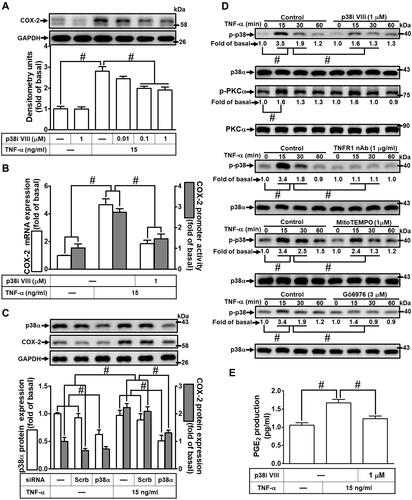
Figure 6 Involvement of JNK1/2 in TNF-α-induced COX-2 expression and PGE2 production in HCFs. (A) The cells were pretreated with various concentrations of SP600125 (1, 3, and 10 μM) for 1 h and then incubated with 15 ng/mL TNF-α for 16 h. The levels of COX-2 and GAPDH protein were determined by Western blot. (B) The cells were pretreated with 10 μM SP600125 for 1 h and then incubated with 15 ng/mL TNF-α for 4 h. The levels of cox-2 and gapdh mRNA were analyzed by real-time PCR (open bars). The cells were co-transfected with COX-2-luci-plasmid along with a β-galactosidase plasmid, pretreated with 10 μM SP600125 for 1 h, and then incubated with 15 ng/mL TNF-α for 2 h. Promoter activity was determined in the cell lysates using a promoter assay kit (solid bars). (C) The cells were transfected with scrambled, JNK1, or JNK2 siRNA, individually, and then incubated with 15 ng/mL TNF-α for 16 h. The levels of COX-2, JNK2, JNK1, and GAPDH proteins were analyzed by Western blot. (D) The cells were pretreated with 10 μM SP600125, 1 μg/mL TNFR1 nAb, 3 μM Gö6976, or 1 μM MitoTEMPO for 1 h and then incubated with 15 ng/mL TNF-α for the indicated time intervals (15, 30, and 60 min). The levels of phospho-JNK1/2, phospho-PKCα, total JNK1/2, and total PKCα proteins were analyzed by Western blot. (E) The media saved from (A) were used to determine the levels of PGE2. Data are expressed as the mean ± S.E.M. of three independent experiments. #p<0.05, as compared with the control.
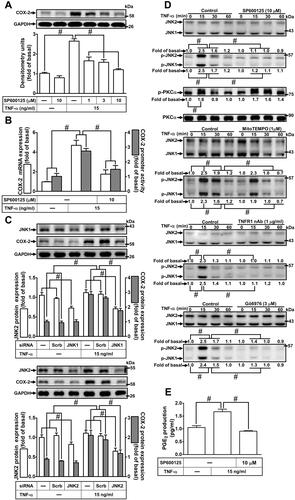
Figure 7 Involvement of FoxO1 in TNF-α-induced COX-2 expression and PGE2 production in HCFs. (A) The cells were pretreated with various concentrations of AS1842856 (10, 30, and 100 nM) for 1 h and then incubated with 15 ng/mL TNF-α for 16 h. The levels of COX-2 and GAPDH protein were determined by Western blot. (B) The cells were pretreated with 1 μM AS1842856 for 1 h and then incubated with 15 ng/mL TNF-α for 4 h. The levels of cox-2 and gapdh mRNA were analyzed by real-time PCR (open bars). Cells were co-transfected with COX-2-luci-plasmid along with a β-galactosidase plasmid, sequentially pretreated with 1 μM AS1842856 for 1 h, and then incubated with 15 ng/mL TNF-α for 2 h. Promoter activity was determined in the cell lysates using a promoter assay kit (solid bars). (C) The cells were transfected with scrambled or FoxO1 siRNA and then incubated with 15 ng/mL TNF-α for 16 h. The levels of COX-2, FoxO1, and GAPDH proteins were analyzed by Western blot. (D) The cells were pretreated with 0.1 μM AS1842856, 1 μg/mL TNFR1 nAb, 3 μM Gö6976, 1 μM MitoTEMPO, 1 μM p38i VIII, or 10 μM SP600125 for 1 h and then incubated with 15 ng/mL TNF-α for the indicated time intervals (15, 30, and 60 min). The levels of phospho-FoxO1 and total FoxO1 proteins were analyzed by Western blot. (E) The cells were pretreated with 0.1 μM AS1842856 and then incubated with 15 ng/mL TNF-α for 60 min. The DNA binding ability of FoxO1 was detected by chromatin immunoprecipitation assay. (F) The media saved from (A) were used to determine the levels of PGE2. Data are expressed as the mean ± S.E.M. of three independent experiments. #p<0.05, as compared with the control.
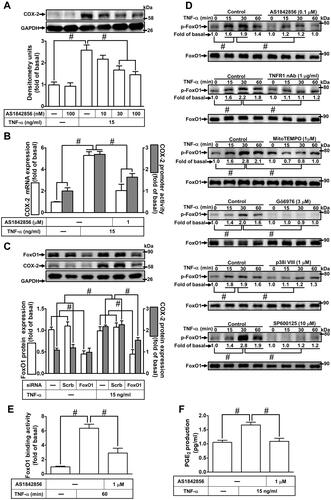
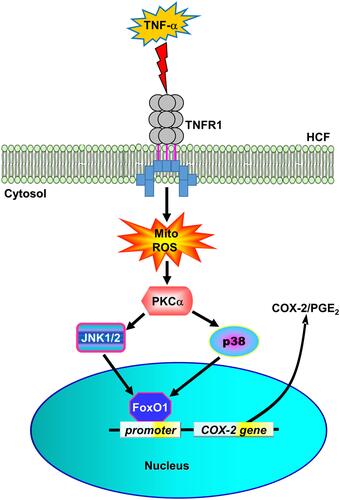
Figure 8 The schematic signaling pathways involved in TNF-α-induced COX-2 expression and PGE2 production in HCFs. TNF-α activated TNFR1 to stimulate mitoROS generation, in turn, activating PKCα/p38 MAPK and JNK1/2 cascade-dependent FoxO1 activity and binding with COX-2 promoter leading to COX-2 expression and PGE2 production in HCFs.