Figures & data
Figure 1 Physicochemical analysis of SPAB. (A) Scanning Electron Microscopy (SEM) analysis of the SPAB identified the presence of particle of different shapes and sizes. (B) Electron dispersive X-ray (EDX) analysis of the SPAB revealed the presence of oxygen (O), Silicon (Si), Iron (Fe), Aluminum (Al), Potassium (K), Magnesium (Mg), Chlorine (Cl), Nickel (Ni), Chromium (Cr), Sodium (Na), Calcium (Ca) elements, with varying content (Inset). (C) X-ray diffraction (XRD) analysis identified the presence of Annite- 1M, Aluminum Magnesium, Aluminum Silicate, Kyanite, Aluminum Oxide, Magnesium Silicate, Maghemite in SPAB sample.
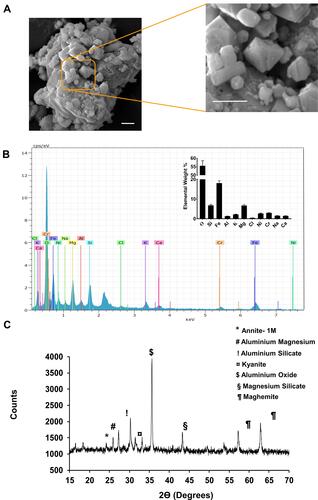
Figure 2 Oral SPAB treatment alleviates Ova-induced leukocyte infiltration in BAL fluid of asthmatic mice. (A) Schematic representation of Ova-induced asthma study design. Mice were acclimatized, randomized, sensitized and challenged with Ova-allergen. Simultaneously, DM and various doses of SPAB were given as mentioned in methods section and tested for the various endpoints, 48 hr post last Ova-challenge by quantifying (B) Total leukocyte count in BAL fluid, (C) Total Eosinophils (D) Total Lymphocytes, (E) Total Monocytes, (F) Total Neutrophils in BALF. Data were presented as the means ± S.E.M (n= 4–6). **, ##p < 0.001 and *p < 0.05 by one-way ANOVA. ##Represents significant compared to NC and **Represents significant compared to DC.
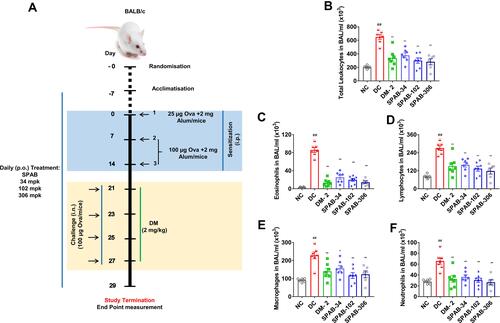
Figure 3 SPAB attenuates allergen-induced mucus hyper secretion by airway epithelia. PAS stained lung histological sections were evaluated for mucus accumulation. (A) PAS stained lung tissue sections of NC, DC, DM, SPAB-34 mg/kg, SPAB-102 mg/kg and SPAB-306 mg/kg. (B) Quantitative histogram of mucus accumulation by airway epithelial cells. (C) Whole lung mRNA expression of Muc5AC gene. Black arrow identifies bronchial epithelium and white arrow represents mucus secreting airway epithelia. Data were presented as the means ± S.E.M (n= 4–6). **, ##p < 0.001 and *p < 0.05 by one-way ANOVA; ##Represents significant compared to NC and *Represents significant compared to DC (Scale bar indicates 20µm).
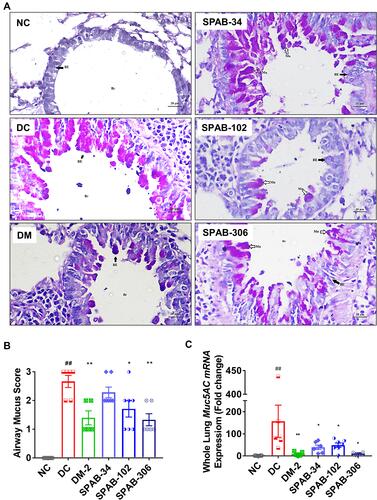
Figure 4 Oral SPAB administration decreases peri-bronchial collagen deposition in allergic mice. OVA-induced collagen deposition around airways was evaluated by Masson’s trichrome staining of lung tissue sections. (A) MT stained lung tissue sections of NC, DC, DM-2 mg/kg, SPAB-34 mg/kg, SPAB-102 mg/kg and SPAB-306 mg/kg. (B) Quantitative histogram of peri-bronchial collagen accumulation. Black arrow points airway epithelia and white arrow indicates collagen deposition. Data were presented as the means ± S.E.M (n= 4–6). **, ##p < 0.001 by one-way ANOVA; ##Represents significant compared to NC and **Represents significant compared to DC (Scale bar indicates 20µm).
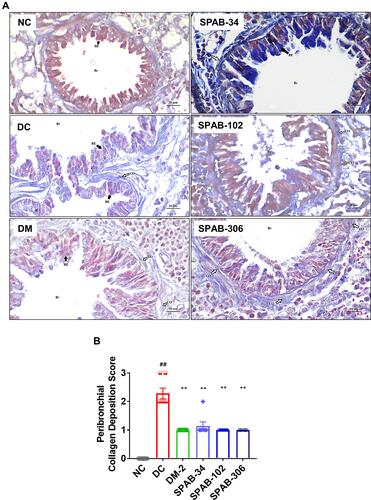
Figure 5 SPAB ameliorates airway inflammatory histo-pathological changes. Lung tissue sections were assessed for airway inflammation using H&E staining. (A) H&E stained lung tissue sections of NC, DC, DM-2 mg/kg, SPAB-34 mg/kg, SPAB-102 mg/kg and SPAB-306 mg/kg. Quantitative analysis of (B) Leukocyte recruitment in lungs, (C) Thickening of bronchial epithelium and (D) Total pathological score. Arrow points at either leukocyte accumulation or thickening of bronchial wall. Data were presented as the means ± S.E.M (n= 4–6). **, ##p < 0.001 and *p < 0.05 by one-way ANOVA; ## Represents significant compared to NC and *Represents significant compared to DC (Scale bar indicates 100 µm and 20 µm).
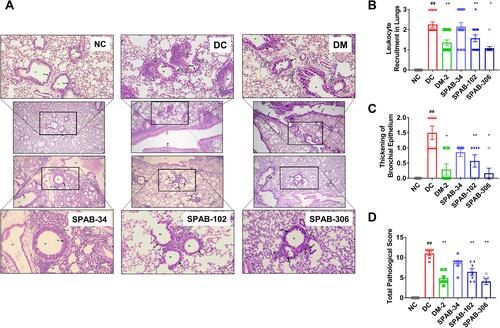
Figure 6 Oral dosing of SPAB attenuates OVA-allergen induced pro-inflammatory cytokine levels. Whole lung tissue steady state mRNA expression levels of cytokines, (A) IL-5, (B) IL-13, (C) IL-33, (D) IFN-γ and (E) IL-1β. BAL Fluid was tested by ELISA for the cytokine levels of (F) IL-1β, (G) TNF-α and (H) IL-6 and proteins. mRNA changes were represented as relative fold change and cytokine levels were presented as pg/mL BALF. Data were presented as the means ± S.E.M (n= 4–6). **, ##p < 0.001 and *p < 0.05 by one-way ANOVA. ##Represents significant compared to NC and **Represents significant compared to DC.
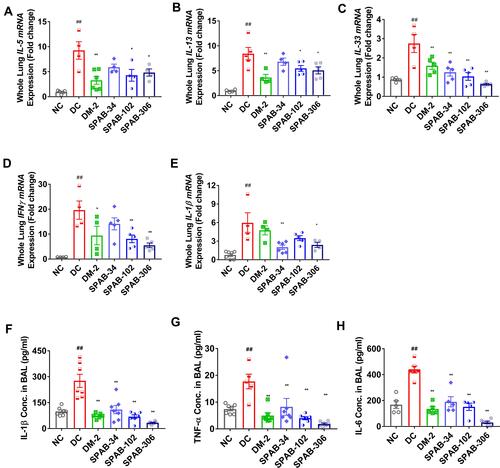
Figure 7 SPAB modulates the oxidant/anti-oxidant levels in whole lung and BALF of allergic mice. Whole lung was homogenised and measured for markers of oxidative stress. (A) GPX activity, (B) CAT activity, (C) SOD activity, (D) GSH levels, (E) GSSG levels, (F) MDA levels and (G) EPO/MPO activity in whole lung and (H) MPO/EPO Activity in BAL fluid. Data were presented as the means ± S.E.M (n= 4–6). **, ##p < 0.001 and *p < 0.05 by one-way ANOVA.; ##Represents significant compared to NC and **Represents significant compared to DC.
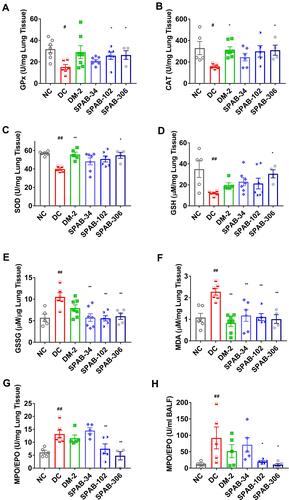
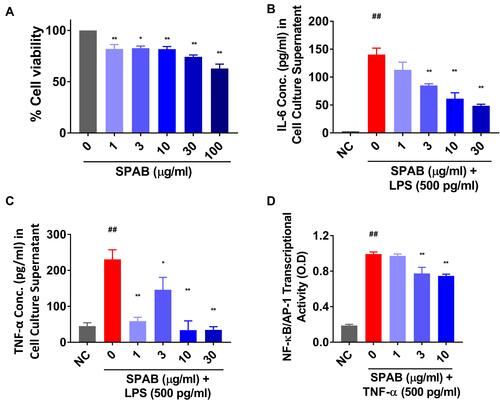
Figure 8 SPAB suppresses the pro-inflammatory responses in BEAS2B cells and HEK Blue cells in-vitro. BEAS2B cells were incubated with different concentrations of SPAB for 24 hr and measured for (A) Cyto-safety, expressed as % cell viability. BEAS2B cells were pre-treated for 24 hr with SPAB followed by LPS+ SPAB co-treatment for another 24 hr. Spent cell culture medium was measured for the secretion of (B) IL-6 and (C) TNF-α cytokines by ELISA. AP-1/NF-kB-SEAP reporter assay. (D) AP-1/NF-kB-SEAP reporter HEK Blue cells were pre-treated with different doses SPAB for 6 hr followed by co-treatment with TNF-α for 24 and measured for SEAP activity. Data were presented as the means ± S.E.M (n= 3). **, ##p < 0.001 and *p < 0.05 by one-way ANOVA. ##Represents significant compared to NC and **Represents significant compared to LPS.