Figures & data
Figure 1 (A) The chemical structure of fisetin. (B) HPLC chromatogram of fisetin.
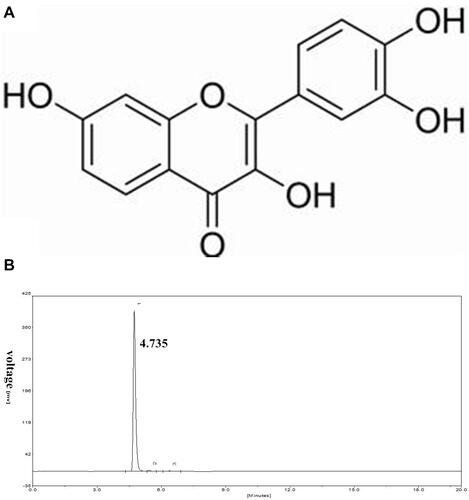
Table 1 Primers Used for qPCR
Figure 2 Network pharmacology analysis of fisetin. (A) Three dimensional structure formula of fisetin. (B) The target classes of fisetin. (C) The potential targets of fisetin were identified using the SwissTarget Prediction. (D) The common target genes of fisetin and inflammatory disease. (E and F) GO annotation and KEGG were used to analyze these target genes.
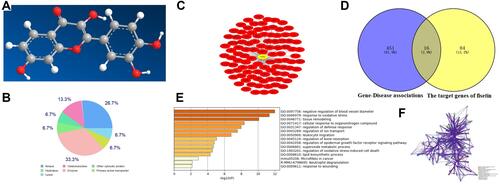
Figure 3 Effects of fisetin on LPS-induced uterine injury. (A) Morphology of the uterus. (B) Control group. (C) LPS group. (D and E) LPS + fisetin (25, 50 mg/kg) treatment groups. (F) Fisetin group (50 mg/kg).
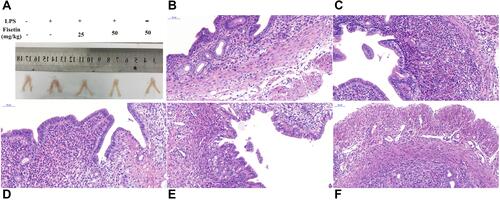
Figure 4 Effects of fisetin on LPS-induced inflammatory responses in mice. (A and B) MPO activity. (C) Expression of TNF-α and IL-1β mRNA in tissues. GAPDH serves as the control. All data are represented as the mean ± S.E.M. of three independent experiments. Hash marks indicate P < 0.05 versus control group. Asterisks indicate P < 0.05 versus LPS group. Double asterisk indicate P < 0.01 compared with LPS group.
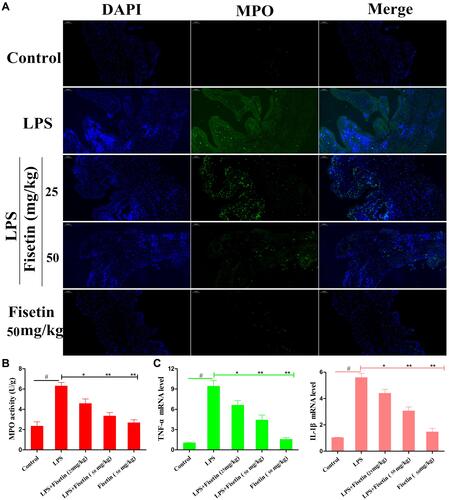
Figure 5 Effects of fisetin on TLR4 expression and NF-κB pathway activation in LPS-induced endometritis. (A) Protein expression of TLR4 in uterine tissues. (B) Proteins expression of IκBα and p65 in uterine tissues. β-actin served as an internal control. All data are represented as the mean ± S.E.M. of three independent experiments. Hash marks indicate P < 0.05 versus control group. Asterisks indicate P < 0.05 versus LPS group. Double asterisk indicate P < 0.01 compared with LPS group.
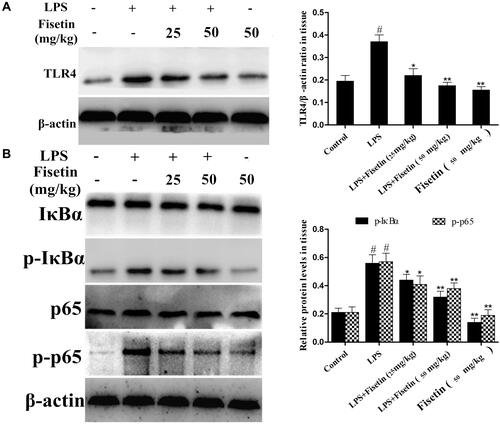
Figure 6 Effects of fisetin on LPS-induced inflammatory responses in BEND cells. Cells were subjected to different concentrations of fisetin for 1 h, and then challenged with LPS (1 μg/mL). (A) Effect of fisetin on the cell viability was measured by MTT assay. (B) Effects of fisetin on the expression of TNF-α and IL-1β were determined by ELISA assay. (C) Expression of iNOS and COX-2 mRNA in LPS-stimulated BEND cells using qRT-PCR method. GAPDH served as the control. All data are represented as the mean ± S.E.M. of three independent experiments. Hash marks indicate P < 0.05 versus control group. Asterisks indicate P < 0.05 versus LPS group. Double asterisk indicate P < 0.01 compared with LPS group.
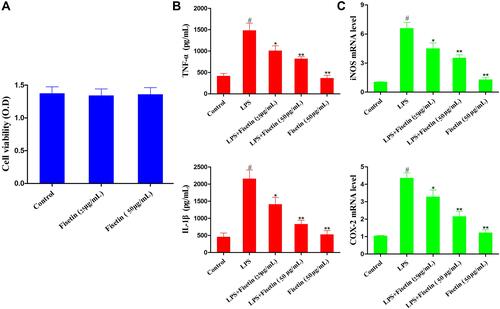
Figure 7 Effects of fisetin on LPS-induced oxidative stress. (A) Effect of fisetin on LPS-triggered ROS production in BEND cells. (B) Effect of fisetin on Nrf2 and HO-1 protein expression levels in LPS-triggered BEND cells. β-actin served as internal control. All data are represented as the mean ± S.E.M. of three independent experiments. Hash marks indicate P < 0.05 versus control group. Asterisks indicate P < 0.05 versus LPS group. Double asterisk indicate P < 0.01 compared with LPS group.
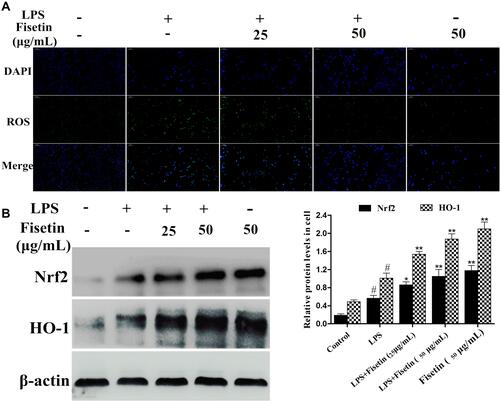
Figure 8 Effects of fisetin on TLR4 expression and NF-κB pathway activation in BEND cells. (A) Expression of TLR4 was detected by Western blot method in LPS-stimulated BEND cells. (B) Proteins expression of IκBα and p65 in LPS-stimulated BEND cells. β-actin served as internal control. All data are represented as the mean ± S.E.M. of three independent experiments. Hash marks indicate P < 0.05 versus control group. Asterisks indicate P < 0.05 versus LPS group. Double asterisk indicate P < 0.01 compared with LPS group.
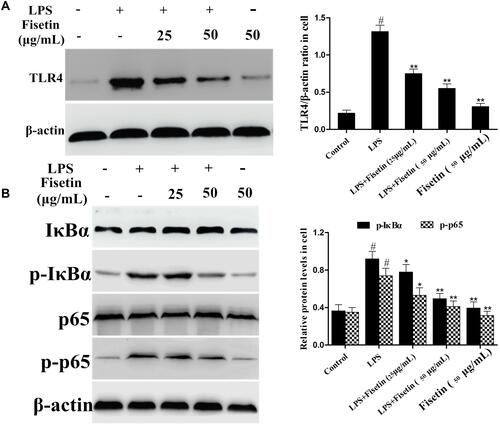
Figure 9 Effects of TLR4-siRNA transfection on LPS-induced inflammatory response. Cells were subjected to transfection with either control siRNA or TLR4 siRNA. (A) The interfering efficiency of TLR4 siRNA was measured by immunofluorescence technique. (B) Immunofluorescence assay was performed to determine the translocation of NF-κB p65 after silencing TLR4 in LPS-stimulated BEND cells. (C) The expression of Nox4 in TLR4-siRNA transfected cells. (D) The effect of TLR4-siRNA transfection on ROS production in LPS-stimulated BEND cells. All data are represented as the mean ± S.E.M. of three independent experiments. Double asterisk indicate P < 0.01 compared with LPS group.
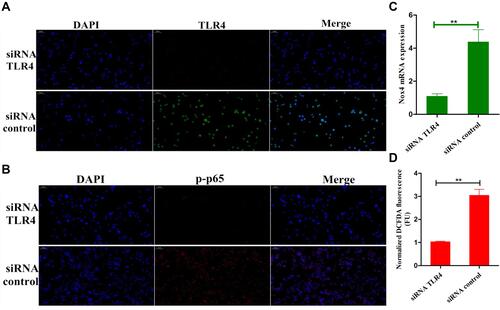
Figure 10 Effects of Nrf2-siRNA transfection on fisetin-induced HO-1 protein expression. The specific siRNA was used to silence Nrf2 expression in BEND cells. (A) The interfering efficiency of Nrf2 siRNA was determined by Western blot. (B) The effect of Nrf2 siRNA transfection on fisetin-induced HO-1 protein expression was also measured by Western blot. β-actin served as control. All data are represented as the mean ± S.E.M. of three independent experiments. Double asterisk indicate P < 0.01 compared with LPS group.
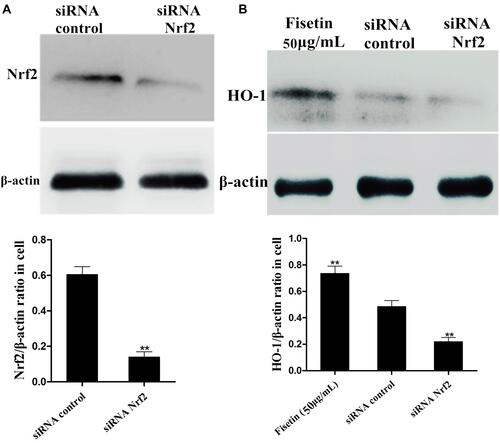
Figure 11 Effects of Nrf2-siRNA transfection on LPS-induced inflammatory response. BEND cells were treated as indicated. After silencing Nrf2, the inhibitory effects of fisetin on LPS-induced inflammatory mediators TNF-α, IL-1β secretion, Nox4 and ROS production were further analysis. (A) The expressions of TNF-α, IL-1β were determined by ELISA kit. (B) The expression of Nox4 in Nrf2-siRNA transfected cells. (C). The production of ROS was detected by immunofluorescence technique. All data are represented as the mean ± S.E.M. of three independent experiments. Double asterisk indicate P < 0.01 compared with LPS group.
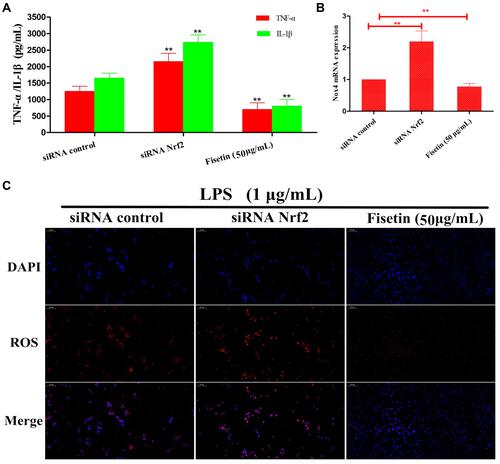
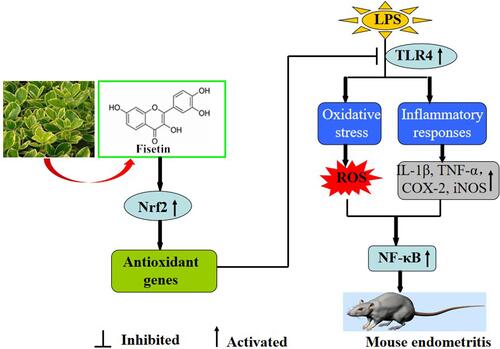
Figure 12 Scheme summarizing the protective effects of fisetin on LPS-induced inflammatory response. Fisetin effectively protected against LPS-induced oxidative stress and inflammation which may be closely correlated to inhibition of TLR4-mediated ROS/NF-κB and activation of the Nrf2/HO-1 pathways.